
Fig. 1. Blunted anti-viral T cell responses in patients with coronary artery disease (CAD).
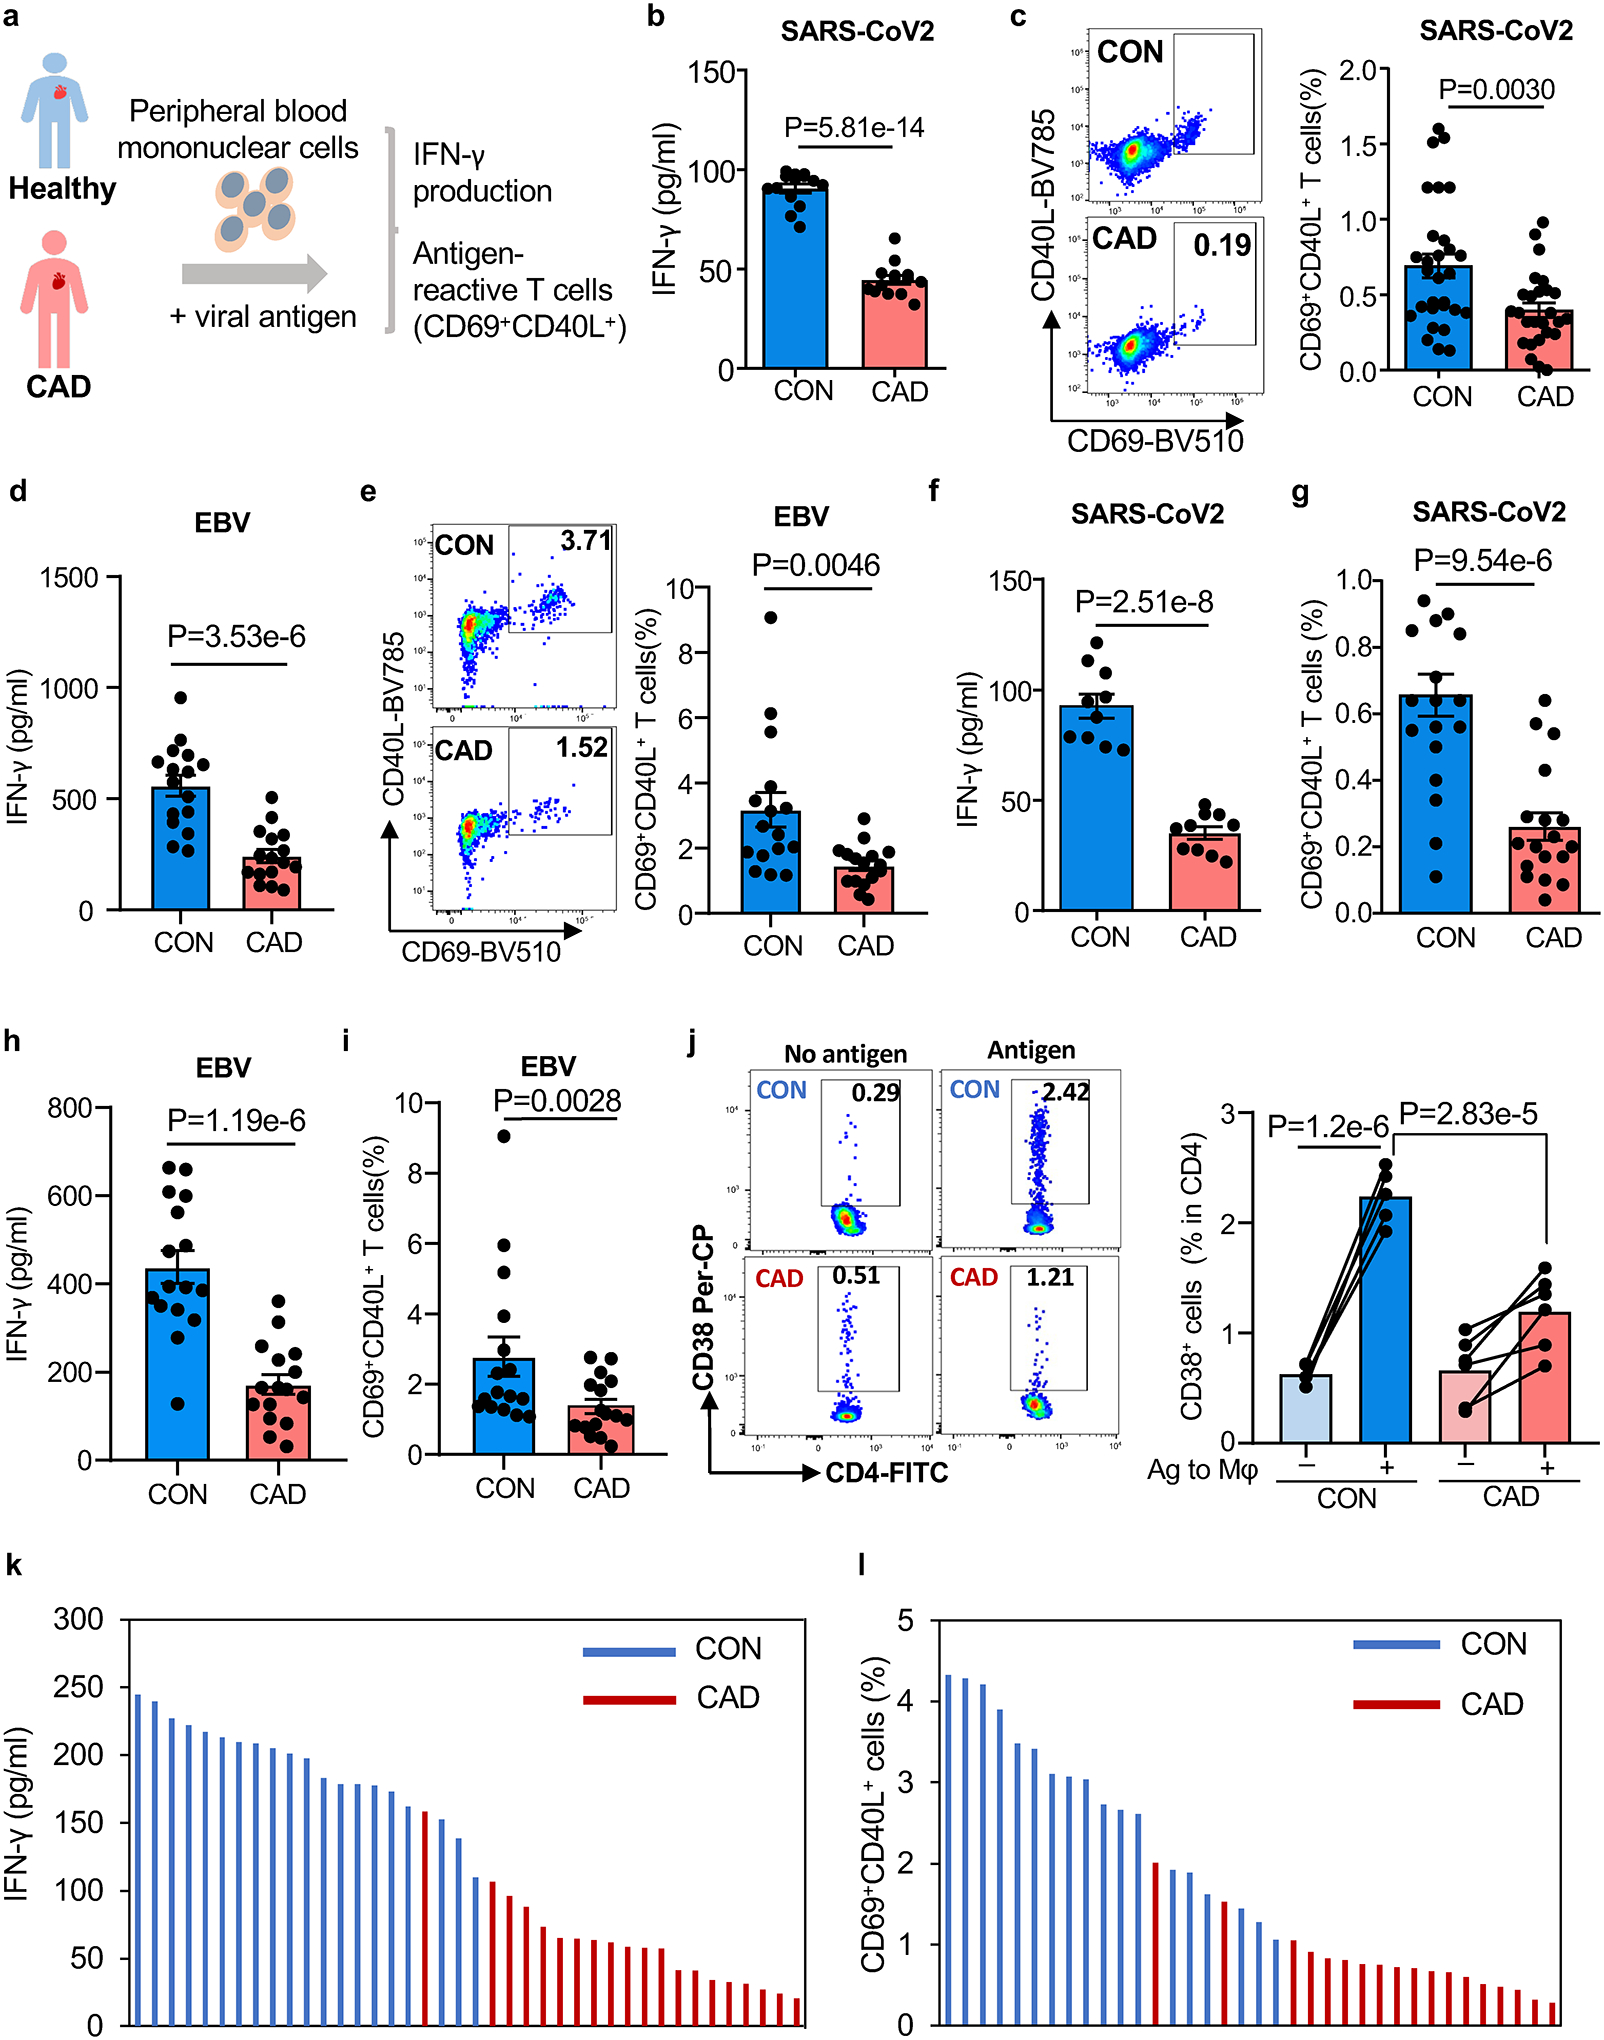
a. Experimental design. Peripheral blood mononuclear cells (PBMC) were stimulated with viral protein antigens (1μg/ml) for 5 days.
b-c. PBMC were stimulated with SARS-CoV2 spike and nucleocapsid antigens for 5 days. IFN-γ was quantified in supernatants (b, n=15). Frequencies of CD4+ CD69+ CD40L+ T cells were measured in 29 controls and 26 patients. Representative dot plots and summary data are shown (c).
d-e. PBMC were stimulated with EBV glycoprotein 350 for 5 days. IFN-γ concentrations (d) and frequencies of CD4+ CD69+ CD40L+ T cells (e). Representative dot blots and summary data are presented (n=16 patients and 16 controls).
f-g. T cells were primed with viral antigens for 5 days and restimulated with autologous antigen-loaded monocyte-derived macrophages (Mϕ). IFN-γ release (f, n=10 patients and controls) and frequencies of CD69+ CD40L+ T cells (g, n=18 patients and 19 controls) in response to SARS-CoV2 antigen-loaded Mϕ.
h-i. Antigen-induced IFN-γ release and frequencies of CD69+ CD40L+ T cells in response to Mϕ loaded with EBV antigen (n=16 patients and 16 controls).
j. Frequencies of CD4+ CD38+ human T cells in the spleen of immuno-deficient mice that were reconstituted with patient-derived or control PBMC and immunized with SARS-CoV2 spike protein (n=6 patients and 5 controls)
k-l. T cell responses to SARS-CoV2 spike protein in patients and controls that had completed vaccination with mRNA-based COVID19 vaccine. IFN-γ secretion and frequencies of antigen-reactive CD69+ CD40L+ T cells. Individual data points are displayed.
Data in Fig.1b–j are shown as mean ± SEM. Paired or unpaired one-way ANOVA were used to analyze the difference. P-values shown in each panel.