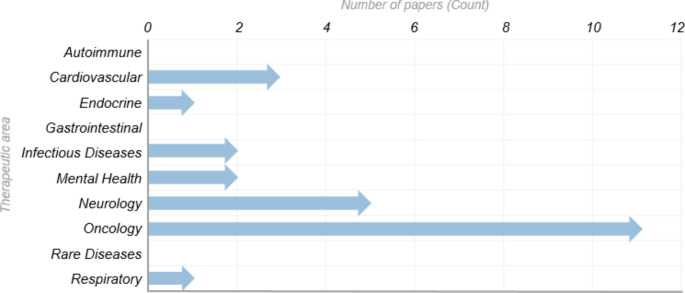
Fig. 3.
Number of papers referring to AI applications per therapeutic area [6]
This graph represents the application of AI across therapeutic areas (TA), as discussed in the publications reviewed. Out of a total of 48 papers that were in scope, 26 papers did not describe a specific TA. The distribution of TAs across the remaining 22 papers is represented in this graph, which include three papers that described two TAs within the same paper

