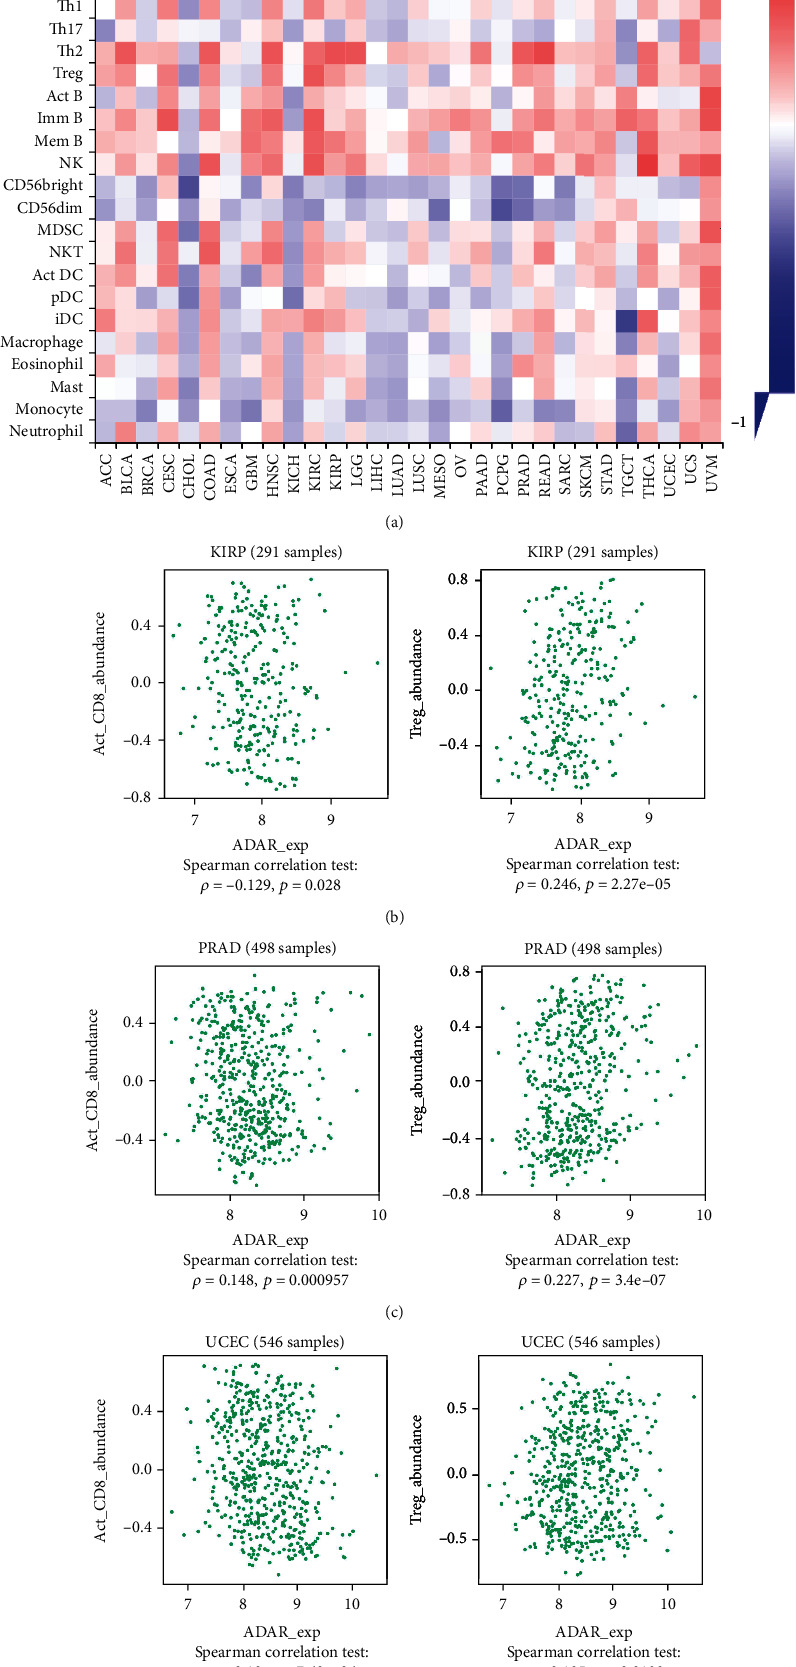
Figure 6.

ADAR1 expression level and immune cell infiltration analysis. (a) Correlation between ADAR1 and the level of infiltration of indicator immune cells by TISDB database. (b) The association of ADAR1 with CD8+ T cell and Treg cell infiltration in KIRP. (c) The association of ADAR1 with CD8+ T cell and Treg cell infiltration in PRAD. (d) The association of ADAR1 with CD8+ T cell and Treg cell infiltration in UCEC.
