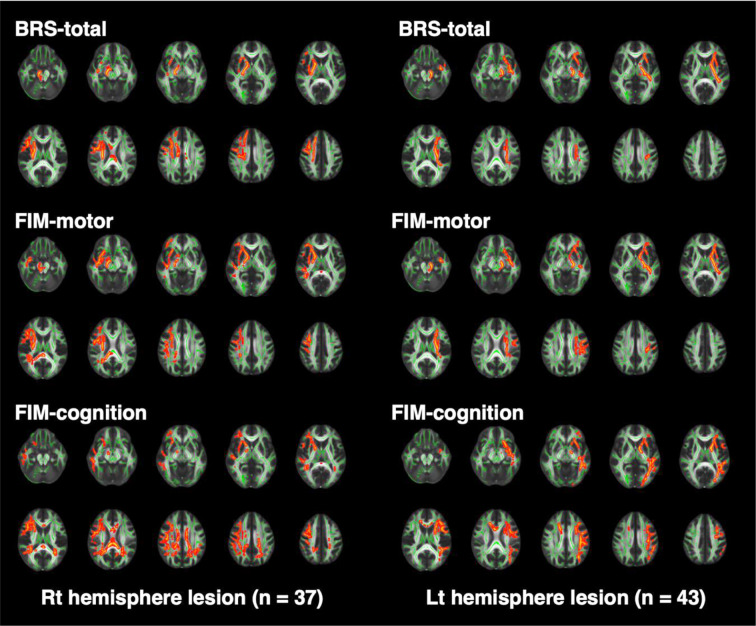
Fig. 1.
Brain images obtained from tract-based spatial statistics.
The FA skeleton representing tract centers is shown in green, whereas voxels with significantly smaller FA values are shown in red. To aid visualization, voxels showing statistical significance (p<0.05) were thickened using the “tbss_fill” command implemented in FSL.
FA: fractional anisotrophy; FSL: FMRIB Software Library; BRS: Brunnstrom recovery stage; FIM: Functional Independence Measure; Lt: left; Rt: right.

