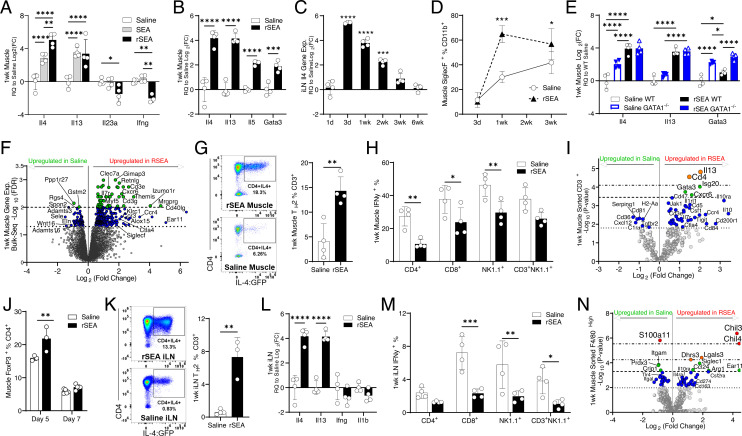
Fig. 1.
rSEA treatment promotes a proregenerative type 2 immune microenvironment after muscle injury. Mice had a partial quadriceps resection to create VML injury and received the indicated treatments administered locally at the time of resection. (A and B) Muscle tissue expression of selected TH2 and TH1 genes assessed by qRT–PCR 1 wk after VML and treatment with saline, unfractionated soluble SEA extract and fractionated SEA formulation (regenerative SEA, rSEA). (C) Il4 gene expression of iLNs from VML-injured mice at different time points after rSEA treatment. (D) Flow cytometric quantitation of postinjury muscle eosinophils, defined by coexpression of Siglec F and CD11b, over time with rSEA treatment. (E) Muscle expression of selected type 2 genes after saline vs. rSEA treatment of WT and GATA1 KO mice. (F) Volcano plot of differential expression from bulk RNA sequencing of the muscle 1 wk postinjury and rSEA treatment referenced to saline-treated injuries by the EdgeR analysis. (G) Flow cytometry of muscle CD3+CD4+ cells from IL4 reporter (4get) mice treated with either saline or rSEA. (H) Muscle IFNγ+ production by various immune cell types assayed by ICS. (I) Gene expression profile of sorted CD3+ T cells from the muscle 1 wk postinjury comparing saline and rSEA. (J) CD4+Foxp3+ (Tregs) in the muscle 5 and 7 d after treatment with either saline or rSEA. (K) Flow plots of iLNs from 4get mice draining VML treated 1 wk with saline or rSEA. (L) iLN gene expression 1 wk after muscle injury and treatment. (M) iLN IFNγ production by various cell types assayed by ICS. (N) Gene expression profiling of CD11b+F4/80+Hi macrophages sorted from the muscle 1 wk after saline vs. rSEA treatment. Statistical tests represent all biological replicates, and all experiments excluding (F, I, and M) were replicated at least twice. Graphs show mean ± SD (A–D, G, H, and J–M) and mean ± SEM, n = 3 to 5 (E). *P < 0.05, **P < 0.01, ***P < 0.001, ****P < 0.0001 by unpaired two-tailed Student’s t test (G and K), and two-way ANOVA with Sidak’s multiple comparisons. For volcano plot differential expression (F, I, and N), the EdgeR analysis was performed for bulk sequencing FDR (F), and sorted cell NanoString analysis FDR values determined by the Benjamini–Yekutieli method (I and N). Dashed lines (F) represent -log10(FDR) < 0.05 and 0.01 and in (I and N) represent -log10(adjusted P value) significance determined by nCounter software (adjusted P < 0.5, 0.1, 0.05, and 0.01, respectively).

