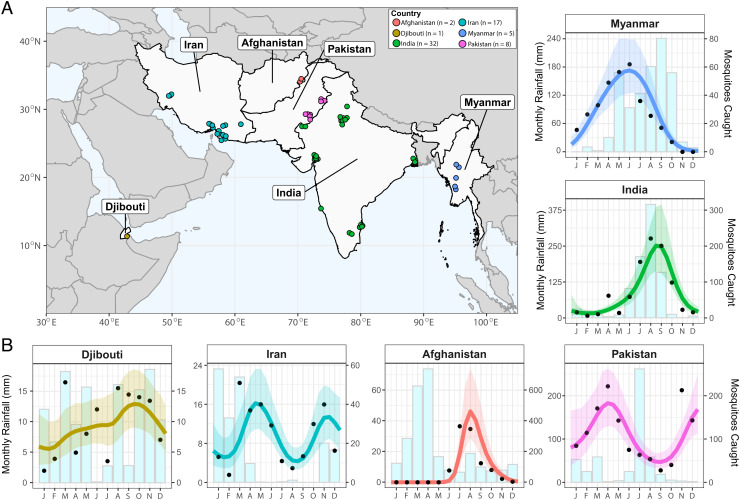
Fig. 1.
Sources and locations of An. stephensi time series data and examples for each country. (A) Map of the geographical range over which time series entomological collections have been carried out. Countries with studies are highlighted in light gray, and the locations of individual studies indicated by the individual points colored according to country (Afghanistan = red, Djibouti = yellow, India = green, Iran = turquoise, Myanmar = blue, and Pakistan = pink). (B) A single example An. stephensi time series from each country, with the empirical monthly mosquito catch (black points), fitted gaussian process curves (mean = colored line, ribbon = 95% bayesian credible interval) and monthly rainfall (matching sampling location and year of sampling) for each (light blue bars with gray surround). The x-axis indicates the month of sampling; the y-axis indicates either the monthly rainfall (left-hand side y-axis) or number of vectors caught in each month (right-hand side y-axis; note that the absolute number of mosquitoes caught between time series are not comparable due to variable sampling effort). n indicates the number of time series in each country.

