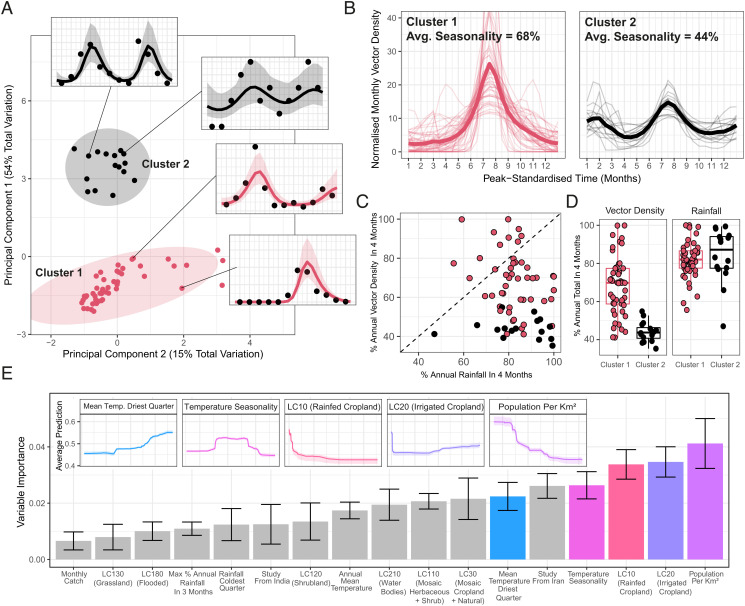
Fig. 2.
Characterization and clustering to identify time series with similar temporal properties. (A) Results of principal component analysis (PCA) and k-means clustering for two clusters. Points on the main figure indicate individual time series, with point color indicating cluster membership. Ellipsoids demarcate the 75th quantile of the density associated with each cluster. Principal components 1 and 2 are plotted together explaining 69% of the total variation in temporal properties across the time series. (B) Time series belonging to each cluster. Pale lines represent individual time series; brighter line indicates the mean of all the time series belonging to that cluster—in all cases, vector density is normalized to sum to 1 over the course of the year and time standardized so that the highest vector density for each time series is arbitrarily set to occur at month 7. (C) Plot comparing the percentage of annual total mosquito catch and percentage of annual total rainfall occurring in any consecutive 4-mo period for each time series colored by cluster membership. (D) Box plots show the percentage of annual total mosquito catch (Left) and annual total rainfall (Right) series occurring in any consecutive 4-mo periods for each time series. Rainfall data come from the CHIRPS dataset (37) and are specific to study location and time period. Each point indicates an individual time series. (E) Variable importance plot for each of the covariates included in the random forest model used to predict cluster membership—bar height indicates the mean variable importance across the 25 individual iterations of random forest fitting, with error bars representing the 95% CI. Inset plots are the partial dependence plots for the top five most important variables in the model showing how the average prediction for Cluster 2 (y-axis, with higher values indicating an increased probability of Cluster 2 membership) varies with (normalized) variable value (x-axis).

