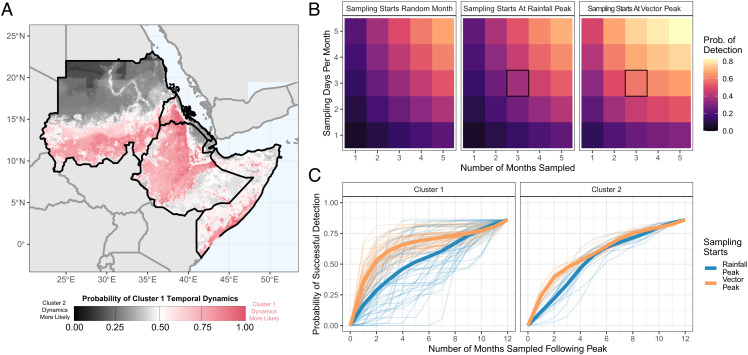
Fig. 3.
Possible seasonal dynamics of An. stephensi across the Horn of Africa, and consequences for entomological surveillance and monitoring. (A) Environmental covariates were collated across countries in the Horn of Africa where An. stephensi has been found, and the random forest classification model from Fig. 2E used to predict potential temporal dynamics. Map shows the probability of temporal dynamics belonging to Cluster 1 (more seasonal), with pink corresponding to Cluster 1 dynamics being more likely, and black indicating Cluster 2 dynamics (more perennial) are more likely, with white indicating both are equally likely. (B) For a setting with an ABR of 20, the average probability (across all 65 collated An. stephensi temporal profiles) of detecting An. stephensi (where detection is defined as catching ≥1 mosquito) for a range of different sampling efforts (number of consecutive months sampled and number of sampling days in each month) in a setting with an ABR of 20 bites per person. These results were generated for three different sampling strategies: i) with sampling starting at a random month in the year (Left-hand panel, subsequently averaged over all possible sampling start months in the year), ii) with sampling starting in the month of peak rainfall (Center panel), and iii) with sampling starting in the month of peak vector density (Right-hand panel). (C) For setting with an ABR of 20 and a sampling effort of 3 d per month, the cumulative probability of An. stephensi detection as a function of the number of consecutive months sampled for each individual time series stratified by sampling strategy (starting at peak vector abundance = orange and at peak rainfall = blue) and cluster. In both panels, pale thin lines indicate the cumulative probability curve for a specific temporal profile, and thicker lines indicate the average for the specific sampling strategy.

