Fig. 4.
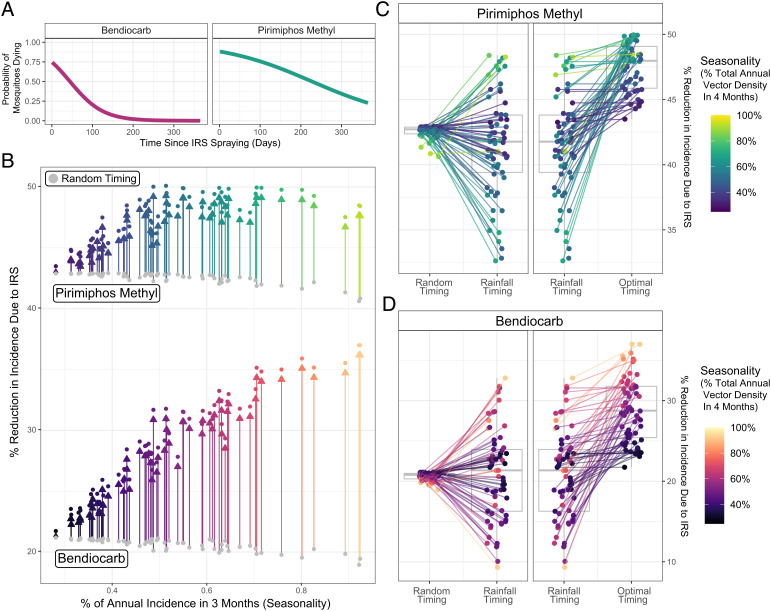
Modeling the public health impact of IRS and the influence of An. stephensi seasonality. (A) Probability of mosquitoes dying upon exposure to each IRS compound in the time period following spraying (46)—pink indicates bendiocarb, and turquoise indicates pirimiphos-methyl. (B) For each temporal profile, the public health impact of annual IRS campaign with each insecticide according to the timing of the campaign. Points in gray correspond to the average reduction in incidence occurring from picking a random month to conducting the IRS campaign for each An. stephensi temporal profile; colored points indicate the reduction in incidence arising from optimally timing the IRS campaign relative to the vector density peak for each An. stephensi temporal profile (and colored arrows indicate the difference). The arrows and points are colored according to i) the insecticide used and ii) the degree of An. stephensi seasonality in each temporal profile (defined as the proportion of total annual abundance in any consecutive 4-mo period). (C) For pirimiphos-methyl and for each An. stephensi temporal profile (colored points), the percentage reduction in malaria incidence achieved if the IRS campaign is timed randomly, timed to start when rainfall is at its peak, or optimally timed based on peak vector density. Points correspond to specific An. stephensi temporal profiles and are colored according to their degree of seasonality. A box plot shows the minimum, first quartile, third quartile, and maximum for the different individual projections. (D) As for (C) but for the insecticide bendiocarb.

