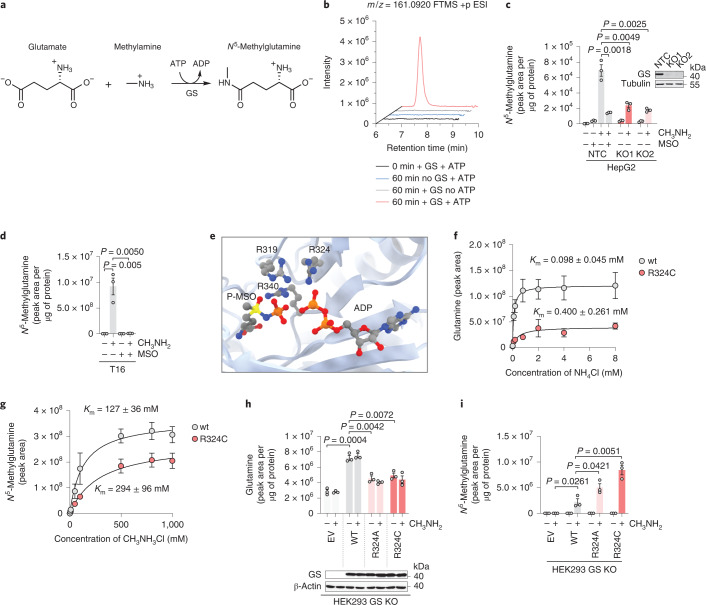
Fig. 4. GS synthesizes N5-methylglutamine from glutamate and methylamine.
a, Non-canonical reaction catalyzed by GS. b, Reaction mixtures described in the Methods and modified as indicated in the figure were sampled at 0 and 60 min from the addition of 40 mM methylamine. Representative extracted ion chromatograms for m/z 161.0920 are shown. c, HepG2 cells deficient for GS (KO1 and KO2) or non-targeting control (NTC) were grown in glutamine-free medium for 24 h and incubated with methylamine (CH3NH2, 0.8 mM) or MSO (1 mM) for an additional 24 h. Data were analyzed by two-tailed Student’s t-test. Bars represent mean ± s.e.m., and each data point represents an independent experiment (n = 3). The inset shows immunoblotting analysis of GS. Tubulin is shown as a loading control (n = 1). d, T16 cells were incubated with methylamine (0.4 mM) or MSO (1 mM) as indicated for 48 h. Data were analyzed by two-tailed Student’s t-test. Bars represent mean ± s.e.m., and each data point represents an independent experiment (n = 3). e, The active site of human GS with highlighted arginine residues, phospho-MSO (P-MSO) and ADP (PDB 2QC8 visualized with UCSF Chimera v1.15). f,g, GS wt and mutant proteins were purified as described in the Methods and in Extended Data Fig. 3c–f. Km values for ammonia (f) and methylamine (g) were calculated using the Michaelis–Menten equation. Samples were collected from the reaction mixtures 15 min after methylamine or ammonia addition. Data points represent mean ± s.e.m. of n = 3 independent experiments. h,i, HEK293 cells deleted for GS (GS KO) were transfected with an empty vector (EV) control or vectors encoding GS wt or R324A and R324C mutant variants. Twenty-four hours after transfection, cells were incubated with methylamine (0.4 mM) for an additional 24 h, and glutamine (h), GS (h immunoblot inset; β-actin is shown as a loading control; n = 1) and N5-methylglutamine (i) levels were measured. Data were analyzed by two-tailed Student’s t-test. Bars represent mean ± s.e.m., and each data point represents an independent experiment (n = 3).

