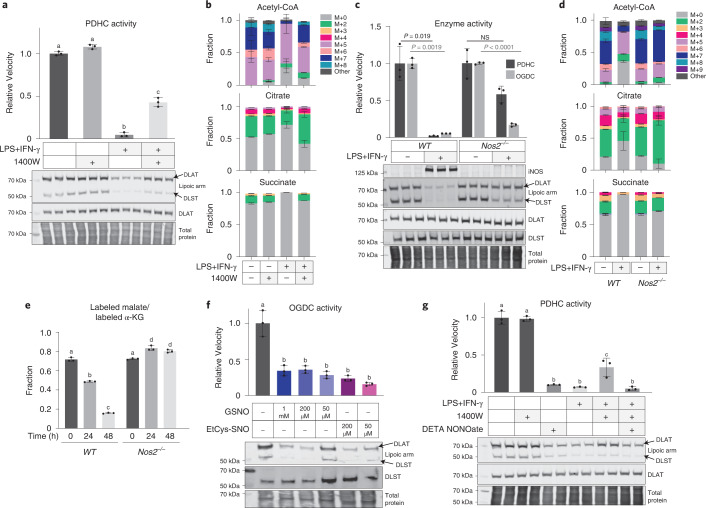
Fig. 2. Loss of PDHC and OGDC activity and their functional lipoic arm depends on NO.
a, Relative PDHC activity and lipoylation state in unstimulated or LPS + IFN-γ stimulated (48 h) RAW 264.7 cells with or without treatment with iNOS inhibitor 1400W (80 µM). Relative activity was normalized to the PDHC activity in unstimulated, untreated cells. b, Labeling patterns of acetyl-CoA, citrate and succinate after incubation with [U-13C]glucose tracer for 24 h in RAW 264.7 cells with or without LPS + IFN-γ stimulation and with or without 1400W for 48 h. M + i indicates the fraction of isotopologue with i-labeled carbons. c, Relative PDHC and OGDC activity and protein lipoylation state in unstimulated and LPS + IFN-γ stimulated (48 h) wild-type (WT) and Nos2 knockout RAW 264.7 cells (Nos2−/−). Relative activity was normalized to the respective unstimulated condition. P values were determined using the two-tailed Student’s t-test. NS, not significant (P > 0.05). d, Labeling patterns of acetyl-CoA, citrate and succinate after incubation with [U-13C]glucose tracer for 24 h in unstimulated or LPS + IFN-γ stimulated wild-type or Nos2−/− RAW 264.7 cells. M + i indicates the fraction of isotopologue with i-labeled carbons. e, Ratio of the labeled malate fraction to the labeled α-KG fraction after incubation with [5-13C]glutamine tracer for 24 h in wild-type or Nos2−/− RAW 264.7 cells stimulated with LPS + IFN-γ for the indicated length of time. f, OGDC activity and protein lipoylation state in the lysate of unstimulated RAW 264.7 cells with or without in vitro treatment of NO donor GSNO or EtCys-SNO at the indicated concentrations (3 h, room temperature). g, PDHC activity and protein lipoylation state in RAW 264.7 cells treated with the indicated combination of LPS + IFN-γ, iNOS inhibitor (80 µM 1400W) or NO donor (200 µM DETA NONOate) for 48 h. All bars and error bars represent mean ± s.d. (n = 3 distinct samples). a,e–g, Data were analyzed using one-way ANOVA followed by Tukey’s post hoc test. Those not sharing a letter are significantly different (P < 0.05) from one another. Exact P values for each comparison are available in the source data. b,d, Statistical comparison (ANOVA and Tukey’s post hoc test) between each labeled form is provided in the source data. Western blots shown in a, c, f and g are representative of at least two independent experiments.

