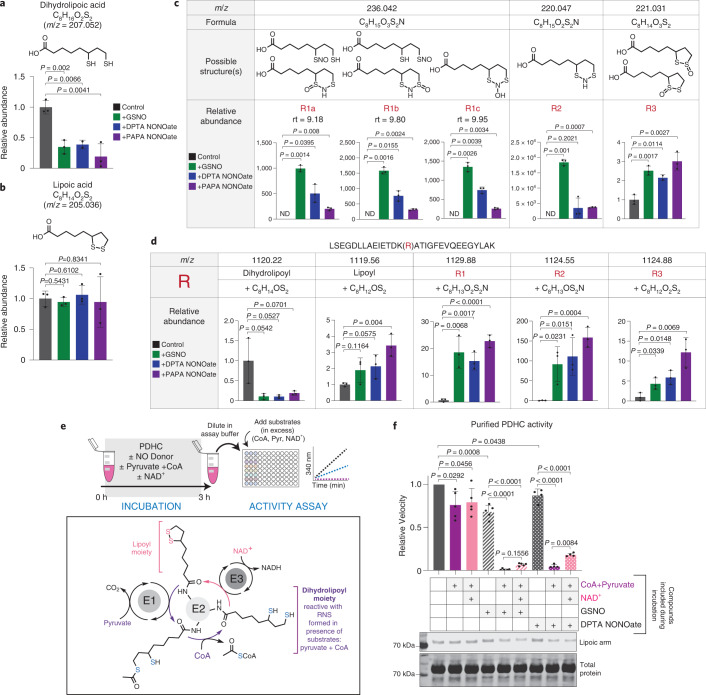
Fig. 3. RNS cause S-modifications on lipoic arm and inactivate its catalytic activity.
a,b, Abundance of DHLA (a) and LA (b) after incubation (3 h, room temperature) with or without NO donor, GSNO, DPTA NONOate or PAPA NONOate. c, Formulas, possible structures and relative abundances of major products after DHLA was incubated with the indicated NO donor (3 h, room temperature). Identified products with a unique formula are designated by R#. m/z is the exact mass of a singly charged negative ion. ND, not detected; rt, retention time. d, Depletion of substrate and appearance of products after dihydrolipoyl peptide LSEFDLLAEIETDK(dihydrolipoyl)ATIGFEVQEEGYLAK was incubated with the indicated NO donors in the presence of CoA (3 h, room temperature). m/z is the exact mass of the 3+ ion, R# corresponds to the modifications identified in c. In this LC condition the different isomers of R1 are not well separated by chromatography. Bars and error bars represent mean ± s.d. (n = 3 distinct samples). P values were determined using one-way ANOVA followed by Dunnett’s multiple comparison test. For species not detectable in controls, a one-sample two-sided Student’s t-test was used to test whether the mean was significantly different from 0. e, Schematic of experimental workflow and the catalytic mechanism of PDHC. After incubation with the indicated compounds, enzyme activity was measured after dilution into assay buffer containing all substrates at saturating levels. f, Activity and lipoylation state of purified PDHC following 3 h incubation (room temperature) with NO donors in the presence or absence of the indicated substrates. Independent experiments were combined and normalized to their own control (PDHC incubated in buffer). Bar graph with error bars represents mean ± s.d. n = 4 distinct samples for DPTA NONOate treatment, otherwise n = 5 distinct samples. For comparison between NO donor-treated samples, P values were determined by ANOVA followed by Tukey’s post hoc test. For comparison with the control (PDHC incubated in buffer), P values were determined using a one-sample t-test to determine whether the mean is significantly different from 1. The shown western blot is representative of two independent experiments.

