Fig. 5.
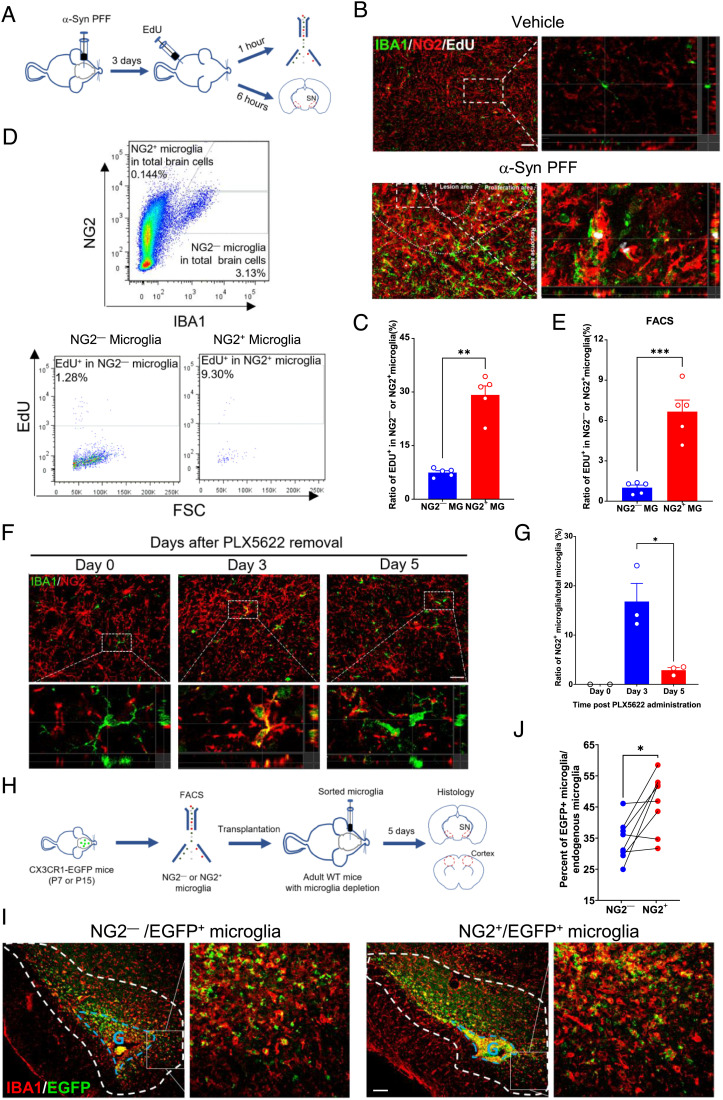
NG2+ microglia are in a state of active proliferation and contribute to microgliosis during microglial repopulation. (A) A diagram showing timeline for EdU administration in mice with injection of α-syn PFFs. (B) Immunofluorescent histochemical staining for NG2, IBA1, and EdU in α-syn PFF-induced PD model. (Scale bar, 50 μm.) (C) Quantitative data showing the percentage of EDU+ cells in NG2− microglia (n = 5) or NG2+ microglia (n = 5) in α-syn PFF-treated animals. (D) Cytometric analysis of EdU+/NG2+/IBA1+ cells in α-syn PFF-induced PD model. (E) Quantitative data shown in D, NG2− microglia (n = 5) and NG2+ microglia (n = 5). (F) Representative immunofluorescent staining for NG2 and IBA1 in WT mice during microglial repopulation post PLX5622 treatment. (Scale bar, 30 μm.) (G) Quantitative data shown in F, Day 0 post PLX5622 (n = 2), Day 3 post-PLX5622 (n = 3), Day 5 post-PLX5622 (n = 3). (H) A diagram showing timeline for microglia transplantation. (I) Immunofluorescent histochemical staining for IBA1 in the SN of mice received transplantation of NG2+ or NG2− CX3CR1-EGFP microglia (P7). G indicates the graft. (Scale bar, 100 μm.) (J) Quantitative data showing the percentage of transplanted microglia derived from NG2+ microglia (n = 8) or NG2− microglia (n = 8) in the region surrounding the graft (circled with dashed white lines). Data are presented as mean ± SEM. *P < 0.05; **P < 0.01; ***P < 0.001.

