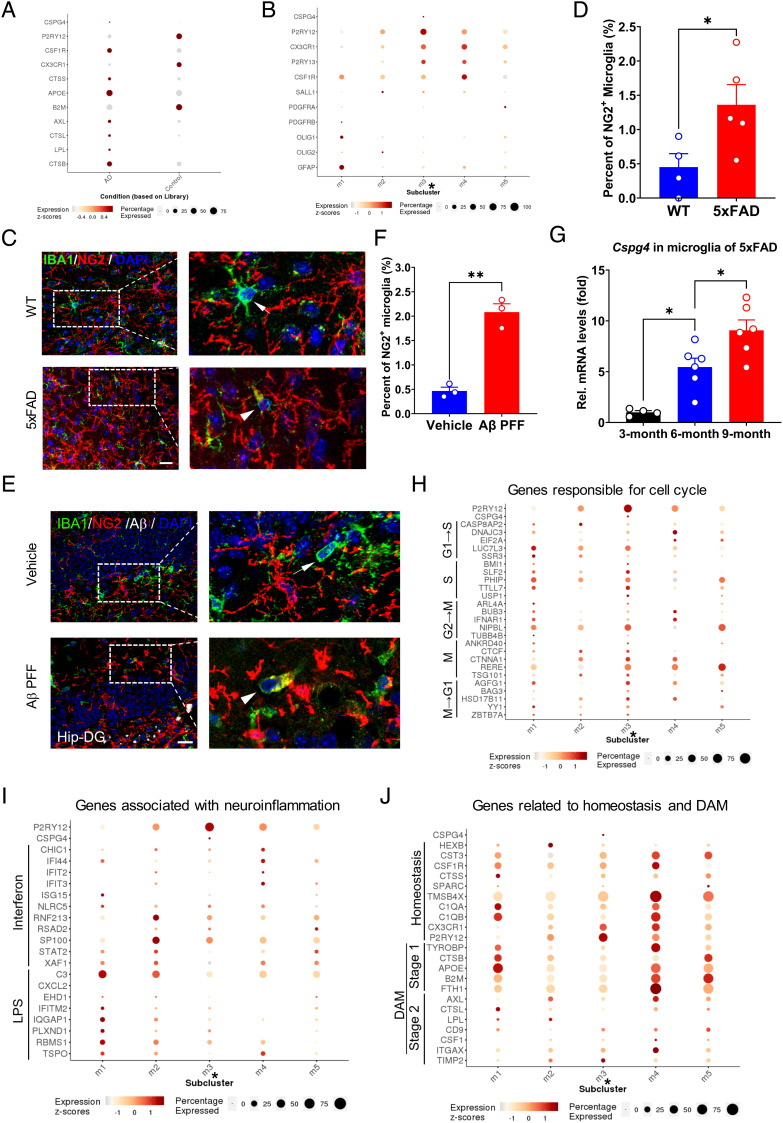
Fig. 6.
Presence of CSPG4high microglia in the brain of AD patients and the expansion of Cspg4+ microglia in animal models of AD. (A) Single-cell analysis for microglial CSPG4 level in the entorhinal cortex of patients with AD. (B) Microglial clusters (m1 to m5) in the entorhinal cortex of subjects with AD. Cluster m3 represents Cspg4high microglia indicated with asterisk (*). (C) Representative immunofluorescent staining for NG2 and IBA1 in WT and 5×FAD mice. Arrows indicate NG2− microglia. Arrowheads indicate NG2+ microglia. (Scale bar, 15 μm.) (D) Quantitative data shown in C, WT (n = 4), 5×FAD mice (n = 5). (E) Representative immunofluorescent staining for NG2 and IBA1 in mice received injection of Aβ PFF or vehicle. Arrows indicate NG2− microglia. Arrowheads indicate NG2+ microglia. (Scale bar, 20 μm.) Hip-DG, hippocampal dentate gyrus. (F) Quantitative data shown in E, vehicle (n = 3), Aβ PFF (n = 3). (G) Representative graph showing relative mRNA levels of Cspg4 in microglia of 5×FAD mice at 3 mo (n = 4), 6 mo (n = 6), and 9 mo (n = 6) of age. (H) A dotplot showing the relative expression of genes responsible for cell cycle (x axis) across all subclusters (y axis). (I) A dotplot showing the relative expression of genes associated with neuroinflammation (x axis) across all subclusters (y axis). LPS, lipopolysaccharide. (J) A dotplot for genes related to homeostasis and DAM (x axis) across all subclusters (y axis). Data are presented as mean ± SEM. *P < 0.05; **P < 0.01; ***P < 0.001.

