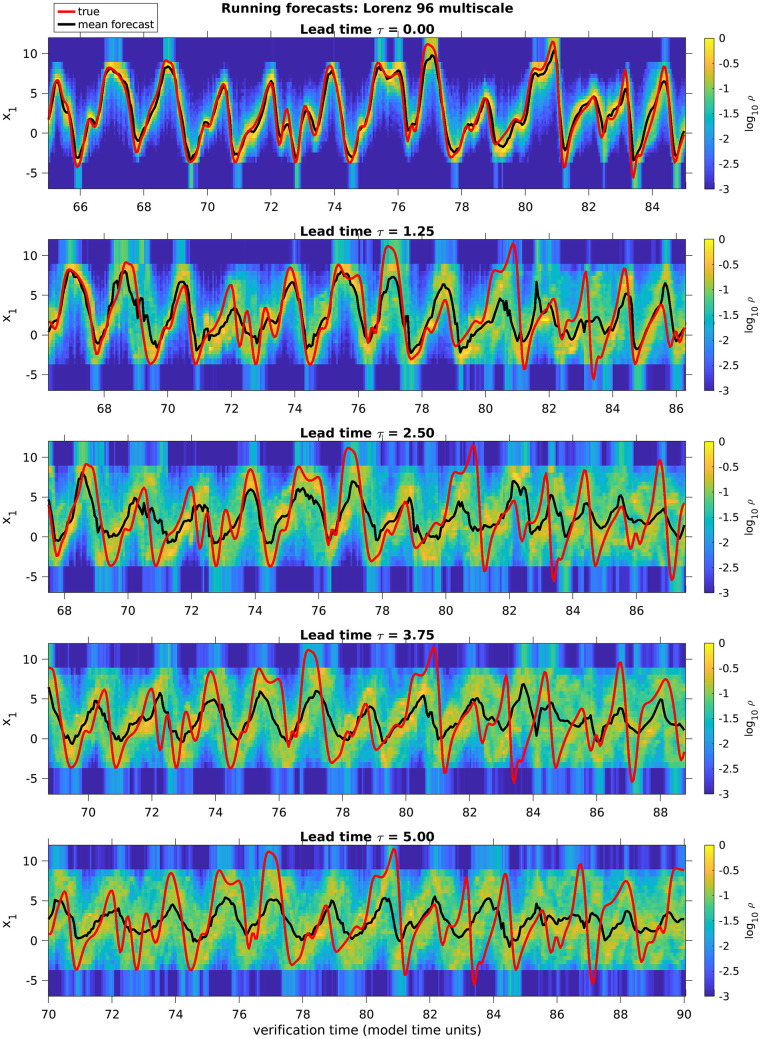
Fig. 2.
Running QMDA forecasts of the x1 variable of the L96 multiscale system in a chaotic regime. The panels show the true x1 evolution (black lines), the logarithm of the discrete forecast probability density 𝜚n, j (colors), and the corresponding forecast mean (red lines) as a function of verification time for lead times in the range 0 to 5 model time units (Top to Bottom). The assimilated observable is the K-dimensional vector (x1, …, xK) of the L96 slow variables.

