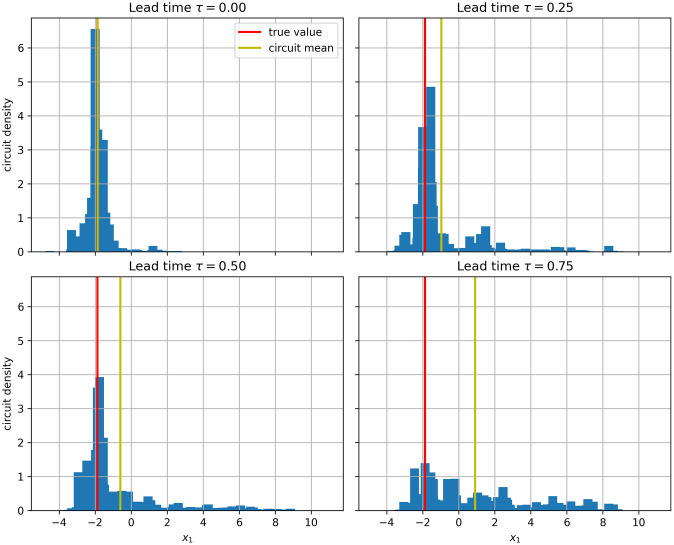
Fig. 7.
Simulated quantum circuit prediction of the x1 variable of the L96 multiscale system using qubits. The histograms show the empirical probability density computed from M = 106 shots for lead times in the range 0 to 3.75 time units. The vertical red lines show the true value of x1 at the verification time, which is held fixed in all experiments. The vertical yellow lines show the empirical mean forecasts.

