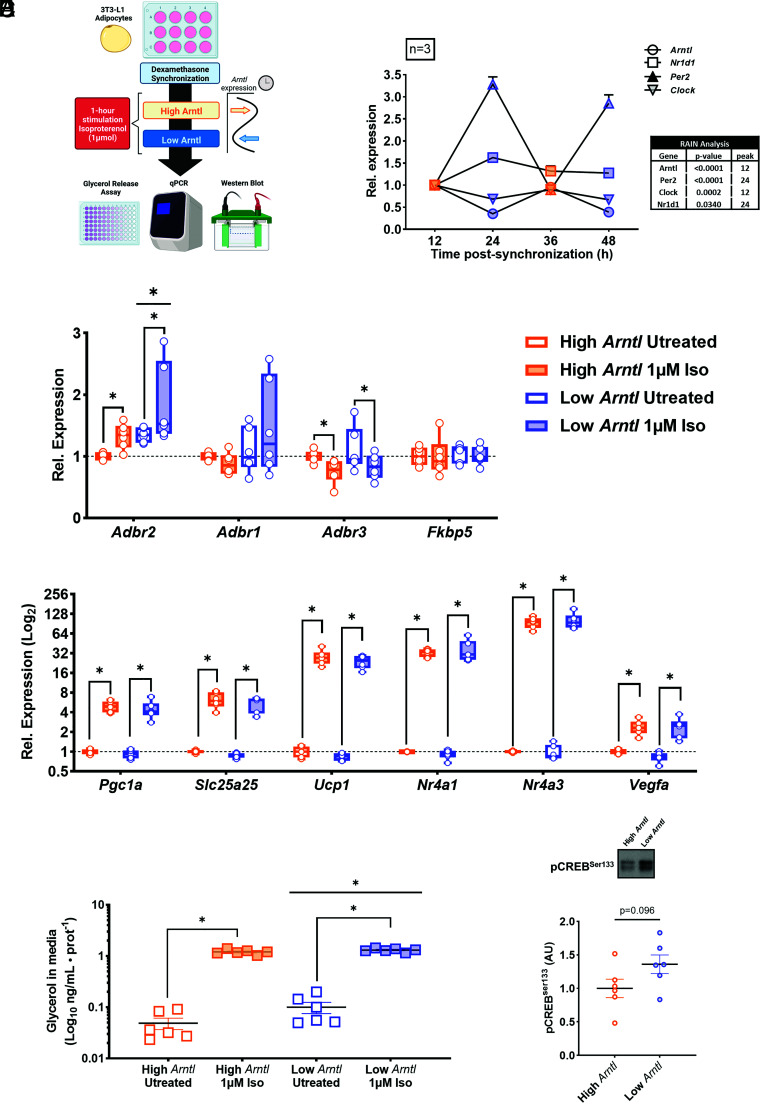
Fig. 3.
Metabolic response in synchronized 3T3-L1 mouse adipocytes in response to time-point-specific exposure to 1 µM isoproterenol (n = 3). (A) Experimental schematic of synchronization (dexamethasone 200 nM) and subsequent isoproterenol (1 µM) treatment. (B) Relative mRNA of clock genes over 48 h with 4 selected time points previously selected to indicate greatest difference in Arntl expression. (C) Relative mRNA level of genes encoding for adrenergic receptor subunits and dexamethasone-responsive marker FK506-binding protein 5 (Fkbp5) in untreated and 1 µM isoproterenol-treated adipocytes. (D) Relative mRNA of previously identified exercise-associated genes in high-Arntl (orange dots) and low-Arntl (blue dots) states. *P < 0.05. (E) Glycerol release assay from untreated and 1 µM isoproterenol-treated 3T3-L1 adipocytes at high-Arntl and low-Arntl states.*P < 0.05. (F) Western blot showing relative abundance of pCREBSer133 in untreated synchronized 3T3-L1 adipocytes in high-Arntl (orange dots) and low-Arntl (blue dots) states.

