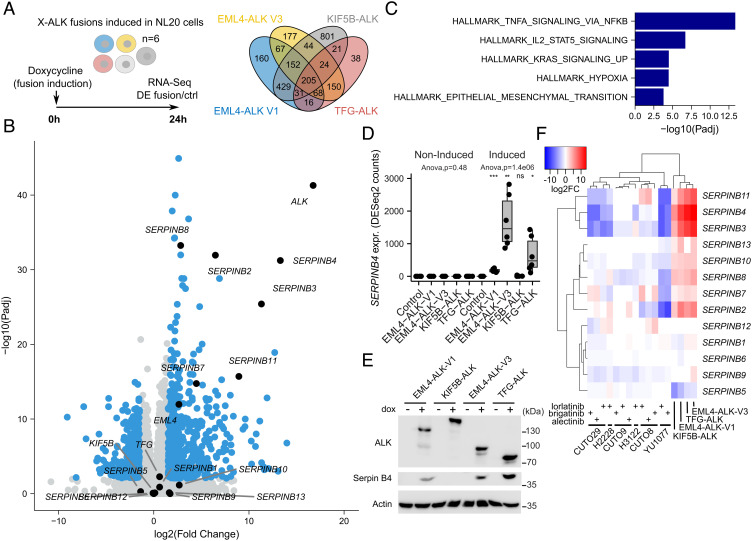
Fig. 2.
Transcriptomic response to ALK fusion expression in NL20 cells. (A) ALK fusions were independently induced in NL20 cells, and RNA-seq-based DE with control cells was determined 24 h after fusion induction with doxycycline (dox). Venn diagram showing the number of DE genes (log2FC +/−1.5 at 1% False Discovery Rate (FDR), using a hyperbolic threshold) for each fusion as indicated. n = 6, RNA-seq analysis from three independent clones per variant performed in duplicate. See SI Appendix, Table S1 for detailed results. (B) Volcano plot showing DE response to EML4-ALK-V3 fusion induction. DE genes indicated in blue with genes discussed in main text indicated and labeled in black. (C) Hallmark GSEA results in 205 common genes that were DE for all four ALK fusions. GSEA was performed using Fisher’s exact test. Bars represent adjusted P-values (−log10 scale) for enriched gene sets at 5% FDR. (D) Box plot showing SERPINB4 expression for all four non-induced and dox-induced ALK fusions and control cells as indicated. ANOVA performed independently on non-induced and induced conditions. Asterisks indicating significance when comparing fusions to Ctrl cells (Student’s t test). NS, non-significant; *P < 0.05; **P < 0.01; ***P < 0.001. (E) Immunoblot validation of Serpin B4 protein expression before and after fusion induction as indicated. (F) Heatmap showing DE log2FC values (color scale at top left) of all 13 SERPINB genes for the four ALK fusions as well as six ALK-positive patient-derived cell lines (CUTO29, H2228, CUTO9, H3122, CUTO8, YU1077) treated with three different ALK inhibitors as indicated. Dendrograms indicate hierarchical clustering results. RNA-seq data generated from H2228 and H3122 as well as from the recent patient-derived CUTO8, 9, 29, and YU1077 cells (24).

