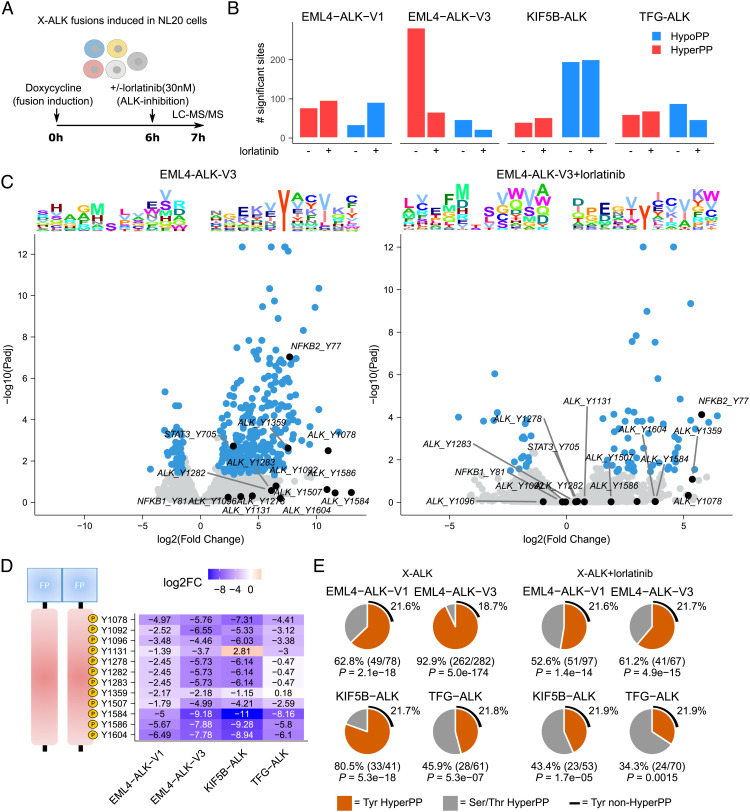
Fig. 3.
Lorlatinib-dependent phosphoproteomic response to ALK fusion induction. (A) DP between the four different ALK fusions and control NL20 cells was determined 7 h after fusion induction with doxycycline (dox). Cells were treated with lorlatinib 6 h after fusion induction as indicated. (B) Bar plot indicating the number of hyper- and hypophosphorylated sites (log2FC +/−1.5 at 5% FDR, using a hyperbolic threshold) in control and lorlatinib treatment conditions as indicated. (C) Volcano plots showing DP response in control (Left) and lorlatinib-treated (Right) EML4-ALK-V3 cells. DP sites indicated in blue with sites discussed in main text indicated and labeled in black. Sequence logo plots showing position-specific enrichment ±5 amino acids centered around the phosphorylation site for hypo- and hyperphosphorylated sites shown on top. (D) Heatmap showing DP (logFC values) between lorlatinib-treated and untreated fusions for all ALK tyrosine sites. Position in ALK indicated (Left). (E) Pie charts showing the proportion of tyrosine motifs in hyperphosphorylated sites in cells expressing ALK fusions in the presence or absence of lorlatinib. P-values calculated using Fisher’s exact test, estimating likelihood of overrepresentation of tyrosines in hyperphosphorylated sites.

