Fig. 5.
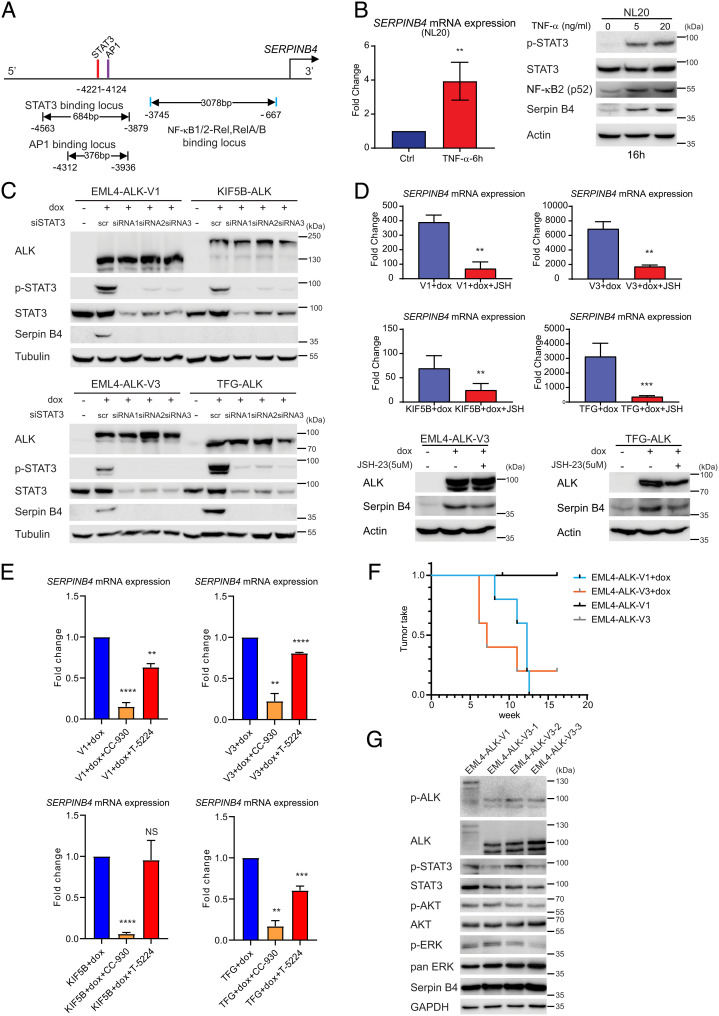
NSCLC ALK fusions drive SERPINB4 expression via STAT3 and NF-κB. (A) Schematic representation of the SERPINB4 promoter region. Red bars show predicted STAT3 binding motifs, and purple and blue bars indicate predicted AP1 and NF-κB binding sites, respectively. (B) TNF-α induces SERPINB4 expression in NL20 cells. NL20 cells were treated with TNF-α for 6 h followed by qRT-PCR on total RNA. (Left) Fold change SERPINB4 mRNA expression normalized to untreated controls (Ctrl), (n = 3; **P < 0.01; two-tailed paired t test). (Right) NL20 cells were treated with TNF-α (0, 5, 20 ng/mL) for 16 h, and lysates subjected to immunoblotting analysis with pY705-STAT3, pan-STAT3, NF-κB2, Serpin B4, and Actin antibodies as indicated. (C) NL20-ALK cells were transfected with either control siRNA (scr) or siRNAs (1 to 3) targeting STAT3 upon doxycycline (dox) addition. Resulting cell lysates were immunoblotted with pan-ALK, pY705-STAT3, pan-STAT3, Serpin B4, and Tubulin antibodies as indicated. (D) NL20-ALK cells treated with JSH-23 (5 µM) for 24 h upon doxycycline (dox) addition followed by either qPCR or immunoblotting analysis. Fold change SERPINB4 mRNA expression was normalized to untreated (no dox) controls and data presented as mean ± SD (n = 3; **P < 0.01; two-tailed paired t test). JSH-23-treated and control cell lysates were subjected to immunoblotting analysis with ALK, Serpin B4, and Actin antibodies as indicated. (E) NL20-ALK cells treated with CC-930 (10 µM) or T-5224 (10 µM) for 24 h upon doxycycline (dox) addition followed by qPCR analysis. Fold change SERPINB4 mRNA expression was normalized to untreated controls and data presented as mean ± SD (n = 3; NS, non-significant; **P < 0.01; ***P < 0.001; ****P < 0.0001; two-tailed paired t test. (F) Doxycycline-induced NL20-EML4-ALK-V1 or NL20-EML4-ALK-V3 cells (2.5 × 10⁶ per injection) were injected into female athymic nude mice in the presence or absence of doxycycline (dox, 625 mg/kg delivered in feed, n = 5) as indicated. Animals in each treatment group were maintained for 15 wk and tumor development monitored. Data are presented as tumor incidence over time. Kaplan–Meier analysis with Mantel–Cox log-rank test and Bonferroni-corrected threshold. P = 0.0044 for V1 vs. V1+dox, P = 0.0128 for V3 vs. V3+dox and P = 0.610 for V1+dox vs. V3+dox. (G) Tumors from EML4-ALK-V1 (one tumor sample) and EML4-ALK-V3 (three tumor samples) were harvested, and homogenized cell lysates subjected to immunoblotting analysis with pY1278-ALK, pan-ALK, pY705-STAT3, pan-STAT3, pS473-AKT, pan-Akt, pT202/Y204-ERK1/2, pan-ERK, Serpin B4, and GAPDH antibodies as indicated.

