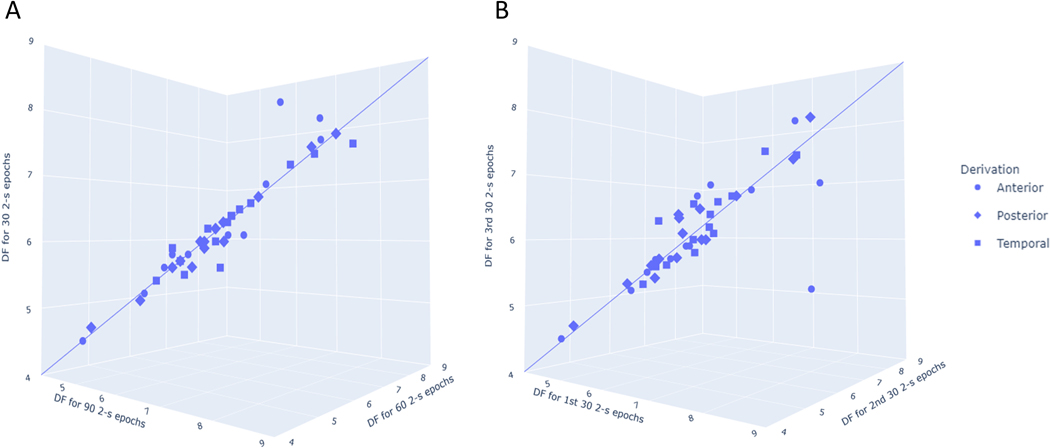
Figure 2. 3-D plots of EEG dominant frequency values for different epoch selections in the Lewy body dementia group.
The 3-d plots show EEG dominant frequency values from analyses of (A) 90, 60, and 30 2-second epochs and (B) the first 30, second 30, and third 30 2-second epochs. An idealized line is plotted to demonstrate that for most individuals and derivations, there was little difference between dominant frequency values derived from analysis of different epoch selections. Visual inspection of the anterior derivation outlier in Figure 2B revealed a high number of blinking artifacts which likely differentially affected feature extraction. Abbreviations: DF: Dominant frequency.

