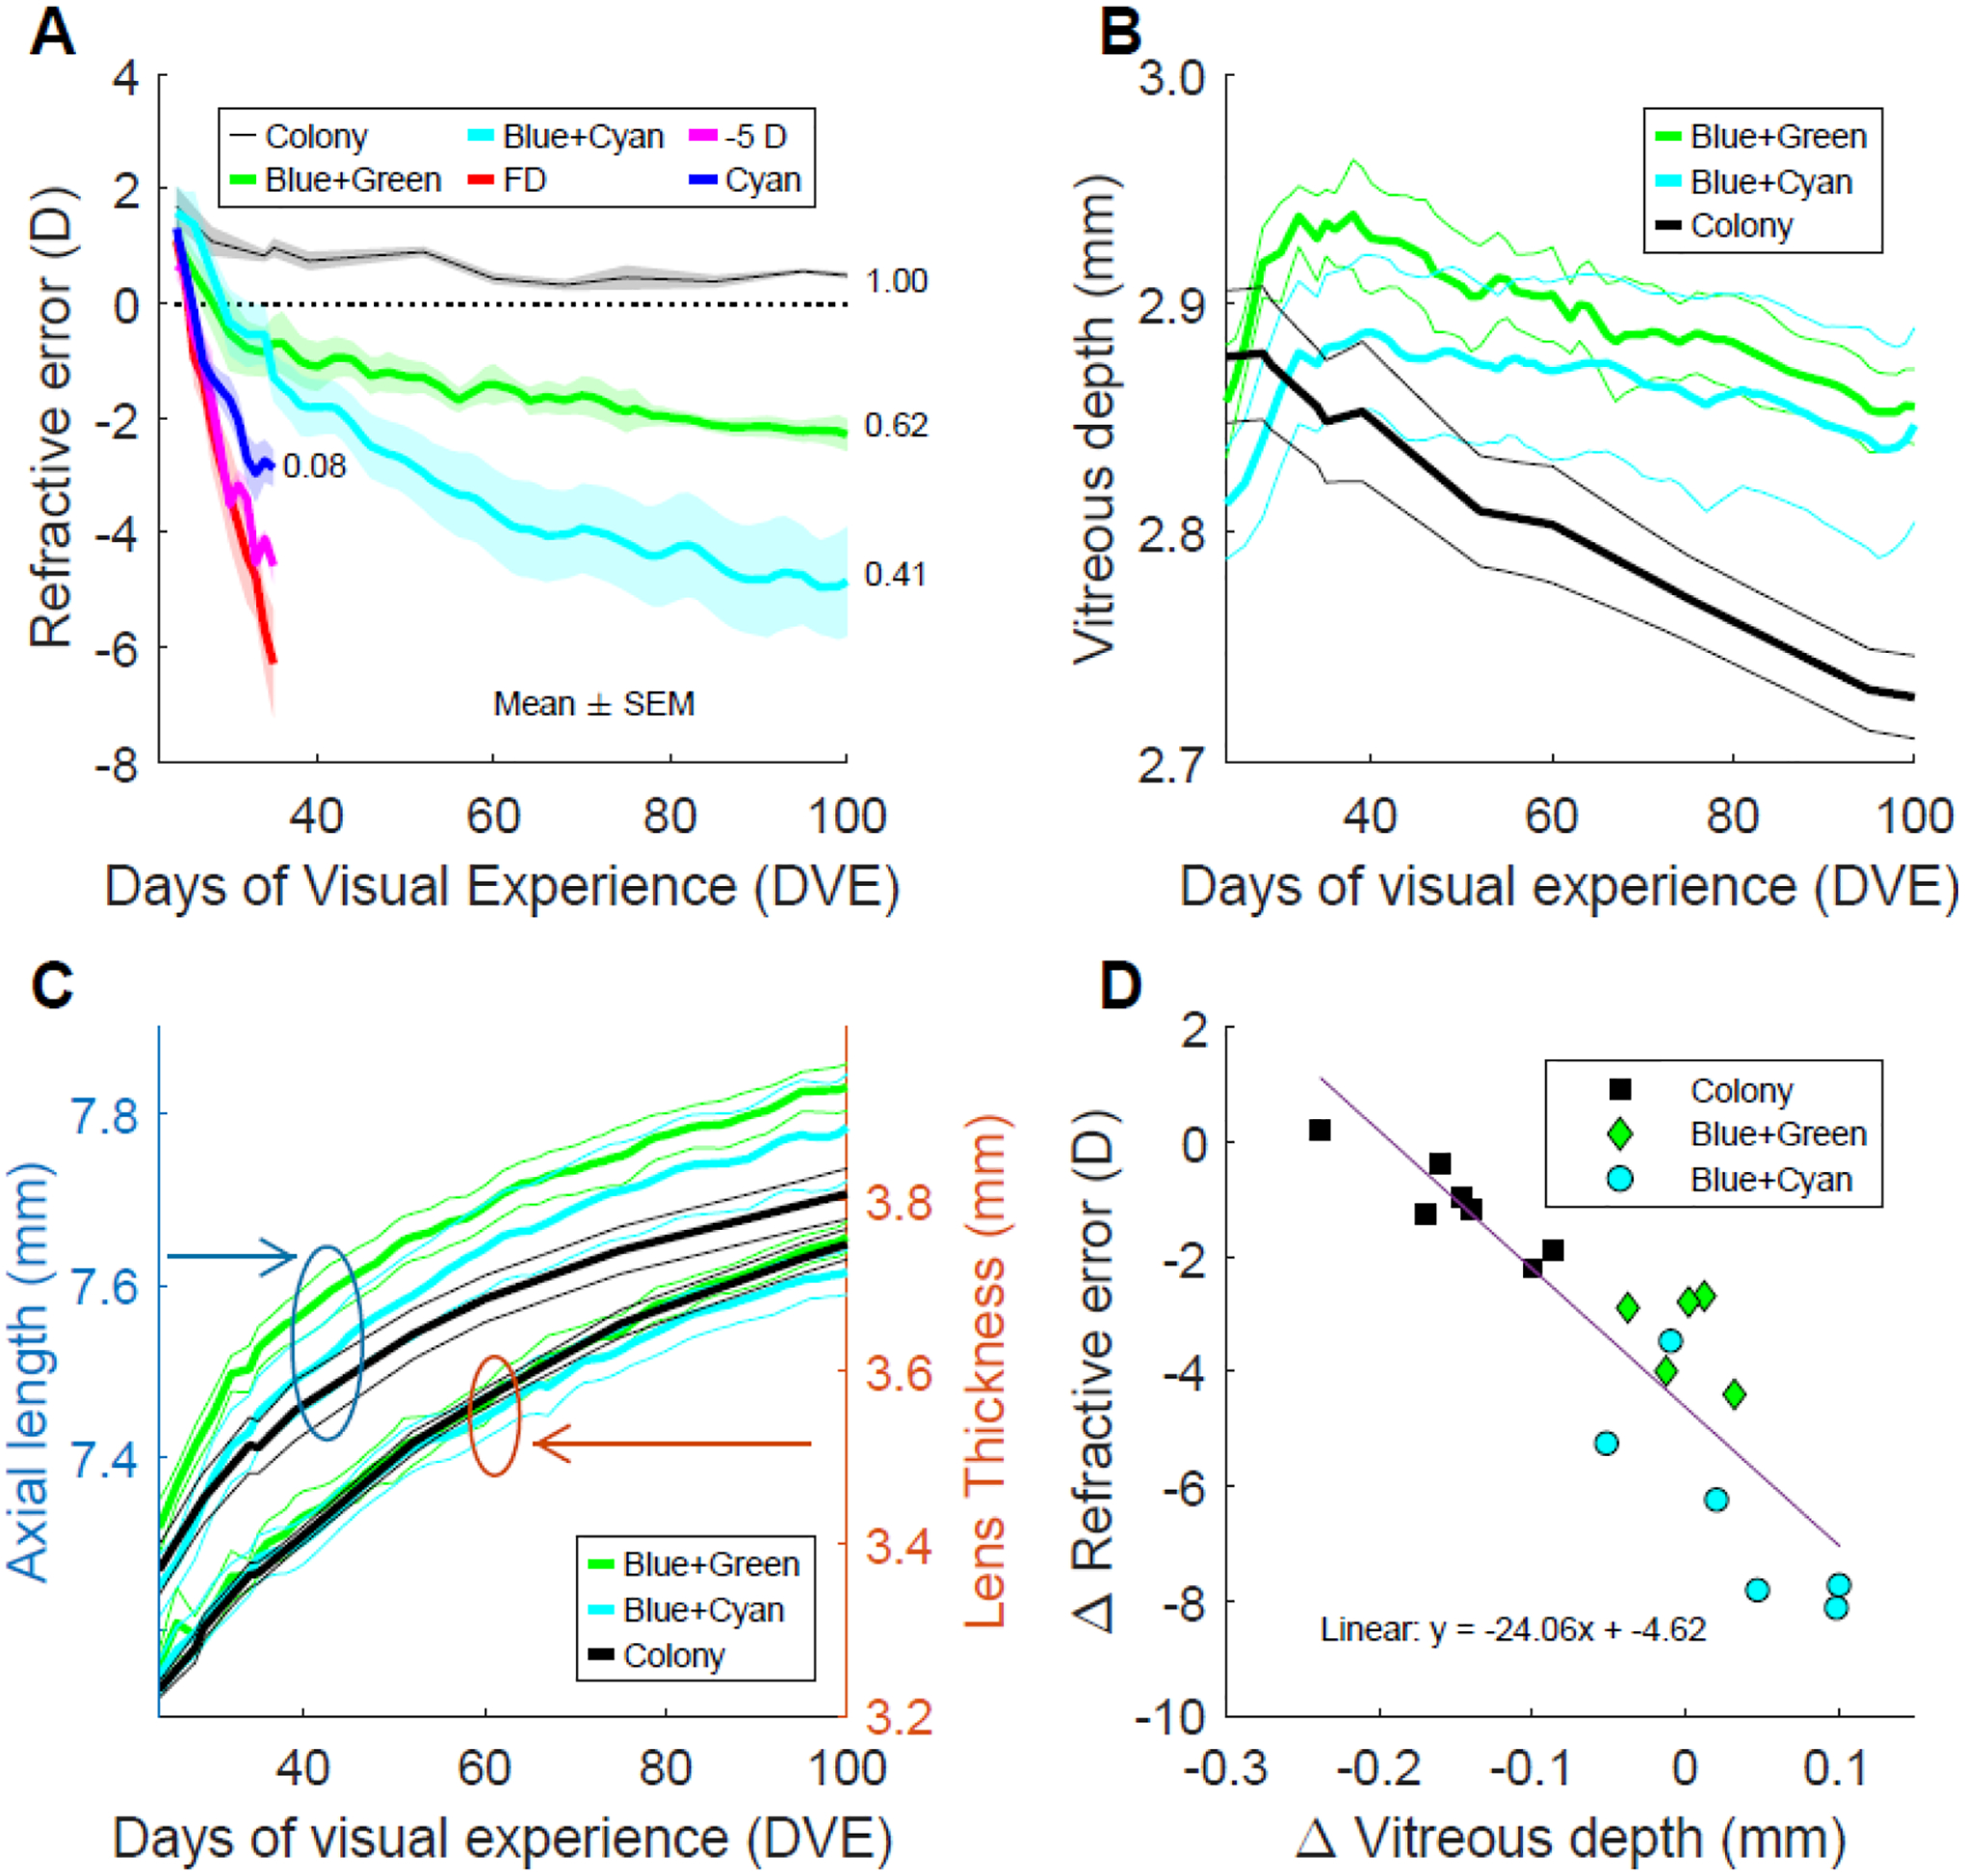
Figure 3.

A. Myopia progression in limited-bandwidth light compared with progression in form deprivation (FD), negative-lens (−5D) wear, and cyan narrow-band light. Black line: mean refractive errors over time of the Colony group (n=7). Green line: mean interpolated refractive errors of the Blue+Green group (n=5). Cyan line: mean interpolated refractive errors the Blue+Cyan group (n=6). Red line: mean refractive errors of eyes with a diffuser (n=6)(Norton et al. 2010). Magenta line: mean refractive errors of eyes with a −5 D lens (n=5)(Norton, et al. 2010). Blue line: mean refractive errors of eyes in cyan light. Shaded regions show ± SEM. Numbers beside the plots indicate the spectral STOP drive to resist myopia progression. B. Change in vitreous chamber depth in Colony, Blue+Green and Blue+Cyan lighting. C. Change in axial length and lens thickness in Colony, Blue+Green and Blue+Cyan lighting showing that lens growth is faster than axial length increase. The vertical scales are the same for both components, but the lens (right scale) is considerably thinner than the axial length. D. Change in refraction vs. change in vitreous chamber depth from 24 to 100 DVE in Colony, Blue+Green and Blue+Cyan lighting. The solid purple line indicates the linear regression fit.
