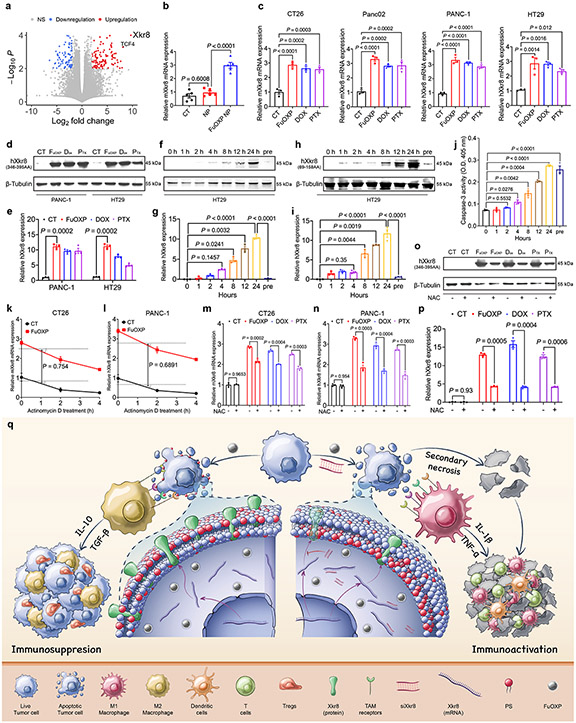
Fig. 1: Xkr8 was induced by chemotherapeutic agents in vitro and in vivo.
a: Volcano plot for the RNA-seq analysis of CT26 tumors treated with FuOXP NPs versus empty NPs. Statistical analysis of RNA-seq was performed by two-tailed Student’s t-test for comparison using Cuffdiff of Cufflinks. b: qRT-PCR analysis of mXkr8 mRNA expression in CT26 tumors treated with FuOXP NPs or empty NPs (normalized against GAPDH). N = 5 tumors per group. c: qRT-PCR analysis of Xkr8 mRNA expression in various types of tumor cells at 24 h following various treatments. N = 3 replicates. d: Western analysis of hXkr8 protein expression in PANC-1 or HT29 cells using anti-hXkr8 (346-395AA) antibody that detects only full-length hXkr8 at 24 h following various treatments. hXkr8 MW: 45 kDa, β-Tubulin MW: 55 kDa. e: Densitometry analysis of protein bands in d. f & h: Western blot analysis of hXkr8 protein expression in HT29 cells using anti-hXkr8 (346-395AA) antibody (f) or anti-hXkr8 (69-158AA) antibody that detects both the full-length and truncated (caspase 3-cleaved) hXkr8 (h). Cells were treated with FuOXP for various times or pre-treated with siXkr8 for 72 h followed by 24 h of FuOXP treatment. g & i: Densitometry analysis of protein bands in f (g)) or h (i). j: Caspase-3 activity in HT29 cells following various treatments as described in f. N= 3 replicates. k & l: Effect of actinomycin D on the FuOXP-induced Xkr8 mRNA expression levels over time in CT26 (k) and PANC-1 (l) cells. N= 3 replicates. m~p: Effect of NAC on drug-induced changes in the expression levels of Xkr8 mRNA in CT26 (m) and PANC-1(n), and Xkr8 protein in PANC-1 cells (o & p). p: Densitometry analysis of protein bands in Western blot (o). q: Proposed strategy of reversing chemotherapy drug-induced Xkr8 induction and immunosuppression through in situ codelivery with siXkr8. Data are presented as mean ± SEM and statistical analysis was performed by two-tailed Student’s t-test for comparison in k and l and one-way analysis of variance (ANOVA) with Tukey post hoc test for comparison in b, c, e, g, i, j, m, n, and p. Data are representative of 2 independent experiments in b, j, k, l, m and n, and 3 independent experiments in c-i, o and p.

