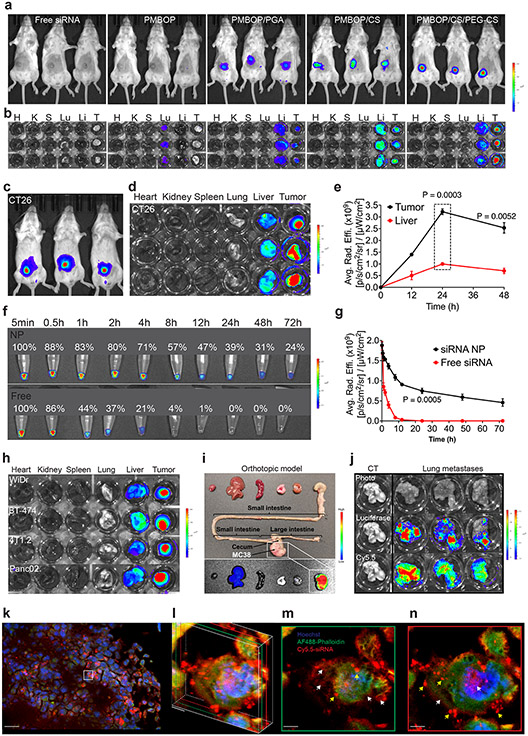
Fig. 3: Optimizing PMBOP-CP NPs for effective tumor targeting in vivo.
a: NIRF whole body imaging of CT26 tumor-bearing mice at 24 h following i.v. administration of free Cy5.5-siXkr8 or various Cy5.5-siXkr8 NPs. N=3 mice per group. b: Ex vivo imaging of tumors (CT26) and major organs at 24 h following i.v. administration of free Cy5-siXkr8 or various Cy5.5-siXkr8 NPs. N=3 mice per group. c: NIRF whole body imaging of CT26 tumor-bearing mice at 24 h following i.v. administration of Cy5.5-siXkr8-loaded PMBOP-CP NPs. d: Ex vivo imaging of tumors (CT26) and major organs at 24 h following i.v. administration of Cy5.5-siXkr8-loaded PMBOP-CP NPs. e: Fluorescence (Cy5.5-siXkr8) intensity at tumors and liver at different times following i.v. administration of Cy5.5-siXkr8-loaded PMBOP-CP NPs. N= 3 mice per timepoint. f & g: Changes in fluorescence (Cy5.5-siXkr8) intensity in blood at different times following i.v. administration of free Cy5.5-siXkr8 or Cy5.5-siXkr8-loaded PMBOP-CP NPs. N= 3 mouse blood samples per timepoint. h & i: Ex vivo imaging of tumors and major organs at 24 h following i.v. administration of Cy5.5-siXkr8-loaded PMBOP-CP NPs in various types of s.c. tumor models (h), a MC38 orthotopic model (i), and a CT-26 lung metastasis model (j), respectively. N=3 mice. k-n: Confocal laser scanning microscopic images of tumor (s.c. CT26) sections at 24 h following i.v. administration of Cy5.5 siXkr8-loaded PMBOP-CP NPs. k: A merged image of cell nuclei (Hoechst), F-actin (Alexa Fluor® 488 Phalloidin) and siRNA (Cy5.5) at a 20x magnification. Scale bar, 30 μm. l: The 3D Z-stacking of two layers of 2D scanning images from different depths. Green: 0.1 μm layer from the first scan (m). Red: 0.5 μm layer from the first scan (n). Magnification, 600x. Scale bar, 1 μm. Yellow arrow: punctuated pattern. White arrow: diffused pattern. Data are presented as mean ± SEM and statistical analysis was performed by two-tailed Student’s t-test for comparison in e and g. Data are representative of 2 independent experiments in a-h and j, and 3 tumor tissues in k-n.

