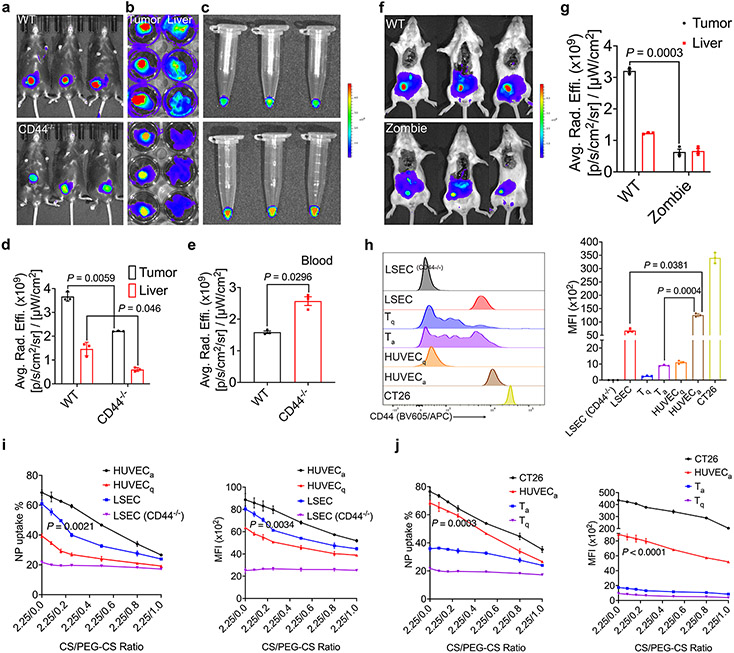
Fig. 4. CD44-mediated vascular targeting plays a role in tumor-targeting.
a & b: NIRF whole body (a) and ex vivo (b) imaging of CT26 tumor targeting in WT and CD44−/− mice at 24 h following i.v. administration of Cy5.5-siXkr8-loaded PMBOP-CP NPs. c: Ex vivo imaging of blood collected from WT and CD44−/− mice bearing CT26 tumors. d & e: Fluorescence (Cy5.5-siXkr8) intensity in tumors and liver (d), and in blood (e) at 24 h following i.v. administration of the NPs. N= 3 mice per group. f: NIRF whole body imaging of CT26 tumor-bearing Zombie mice. Mice were fixed prior to circulation of Cy5.5-siXkr8-loaded PMBOP-CP NPs for 6 h using trans-cardiac perfusion. N= 3 mice per group. g: Fluorescence (Cy5.5-siXkr8) intensity in tumors and livers at 6 h following trans-cardiac perfusion of the NPs. N= 3 mice per group. h: Flow analysis of CD44 expression in mouse LSECs (WT and CD44−/−), Tq, Ta, HUVECq, HUVECa and CT26 cells. N= 3 replicates. i: Quantitative analysis of the % of Cy5.5+ cells and the MFI at 4 h following incubation of Cy5.5-siXkr8-loaded PMBOP-CP NPs with LSECs (WT and CD44−/−), HUVECq, and HUVECa cells, respectively. N= 3 replicates. j: Quantitative analysis of cellular uptake of Cy5.5-siXkr8-loaded PMBOP-CP NPs by CT26, HUVECa, Tq, and Ta cells. N= 3 replicates. Data are presented as mean ± SEM and the statistical analysis was performed by two-tailed Student’s t-test for comparison in d, e and g, and one-way analysis of variance (ANOVA) with Tukey post hoc test for comparison in h, i and j. Data are representative of 2 independent experiments in all panels.

