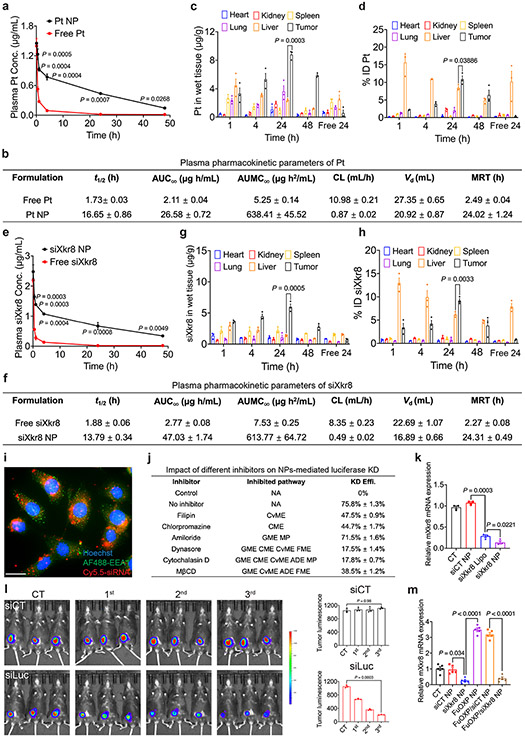
Fig. 5. In vivo PK and tissue distribution of siXkr8 and FuOXP following i.v. administration of FuOXP/siXkr8 NPs, and the efficiency of gene knockdown.
a: ICP-MS analysis of plasma concentrations of Pt after i.v. injection of free FuOXP/siXkr8 (in Cremophor EL) or FuOXP/siXkr8 NPs in BALB/c mice bearing CT26 tumors at a dose of 1 and 5 mg/kg for siRNA and FuOXP, respectively. N=3 mice per group. b: Pharmacokinetic parameters of Pt were analyzed by a non-compartmental model. N=3 mice per group. c & d: Biodistribution of Pt in different organs following same treatments in a. N= 3 mice per group. e: qRT-PCR analysis of plasma concentrations of siXkr8 following same treatments in a. N=3 mice per group. f: Pharmacokinetic parameters of siXkr8 were analyzed by a non-compartmental model. N=3 mice per group. g & h: Biodistribution of siXkr8 in different organs with same treatments in a. N= 3 mice per group. i: Fluorescence microscopic images of cultured CT26 tumors cells at 2 h following treatment with Cy5.5-siXkr8-loaded NPs. Scale bar, 10 μm. j: Cultured MC38-Luc cells with or without pretreatment of different inhibitors (1 h) were treated with siLuc NPs for 24 h followed by luciferase assay. N=3 replicates. k: qRT-PCR analysis of Xkr8 mRNA expression levels in CT26 cells 24 h following various treatments. N= 3 replicates. l: C57BL/6 mice bearing MC38-Luc tumors received i.v. administration of siLuc NPs once every 5 days and the mice were subjected to whole body bioluminescence imaging one day after each treatment. N= 3 mice per group. m: CT26 tumor-bearing mice received various treatments for 3 times once every 5 days at 1 and 5 mg/kg for siRNA and FuOXP, respectively. The mRNA expression levels of Xkr8 in tumors were examined by qRT-PCR one day after the last treatment. N= 5 mice per group. Data are presented as mean ± SEM and the statistical analysis was performed by two-tailed Student’s t-test for comparison in a and e, and one-way analysis of variance (ANOVA) with Tukey post hoc test for comparison in c, d, g, h, k, l and m. Data are representative of 2 independent experiments in all panels.

