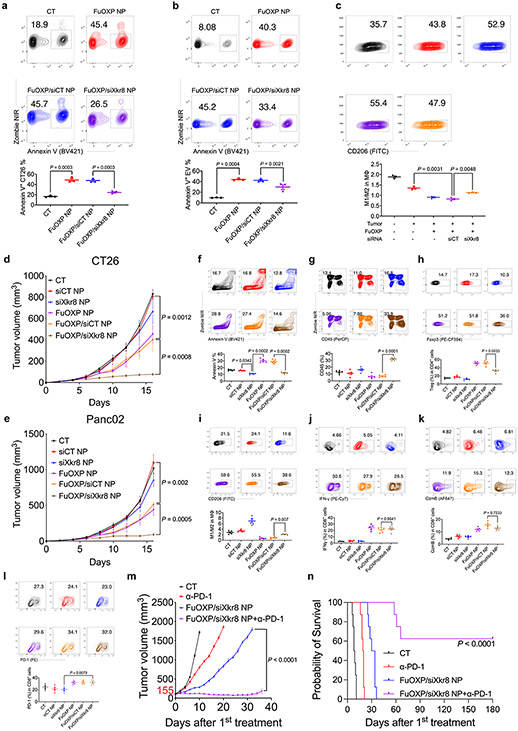
Fig. 6. Biological consequences of Xkr8 knockdown in vitro and in vivo.
a: CT26 tumor cells were treated with control or siXkr8 NPs for 72 h followed by treatment with FuOXP/siRNA-coloaded NPs. The numbers of Annexin V+ cells were examined by flow 24 h later. N= 3 replicates. b: CT26 tumor cells received similar treatments as described in a and the amount of secreted Annexin V+ EVs was examined by flow. N= 3 replicates. c: CT26 tumor cells received similar treatment as described in a and the tumor cells were then co-cultured with resident peritoneal macrophages. The percentages of M1 and M2 cells were then quantified. N= 3 replicates. d & e: Mice bearing CT26 (d) or Panc02 (e) tumors received various treatments once every 5 days for 3 times at 1 and 5 mg/kg for siRNA and FuOXP, respectively. Tumor volumes were followed once every 2 days. N= 5 mice per group. f-k: Single cell suspensions were prepared at the completion of therapy study described in d and subjected to flow analysis including Annexin V+ cells (f), CD45+ cells (g), Treg cells (h), M1/M2-like ratios (i), IFNγ+ CD8+ cells (j), and GzmB+ CD8+ cells (k), respectively. N= 5 mice per group. l: Single cell suspensions were prepared at the completion of therapy study described in e and subjected to flow analysis of PD-1+ CD8+ cells. N= 5 mice per group. m~n: Mice bearing Panc02 tumors received various treatments when the tumors reached ~155 mm3 in sizes once every 5 days for 3 times at a dose of 1, 5 and 10 mg/kg for siXkr8, FuOXP, and anti-PD-1, respectively. Tumor growth (m) and survival (n) were followed. N= 8 mice per group. Data are presented as mean ± SEM and statistical analysis was performed by one-way analysis of variance (ANOVA) with Tukey post hoc test for comparison in all panels. All related gating strategies are shown in Suppl Fig. 17. Data are representative of 2 independent experiments in panels a-l.

