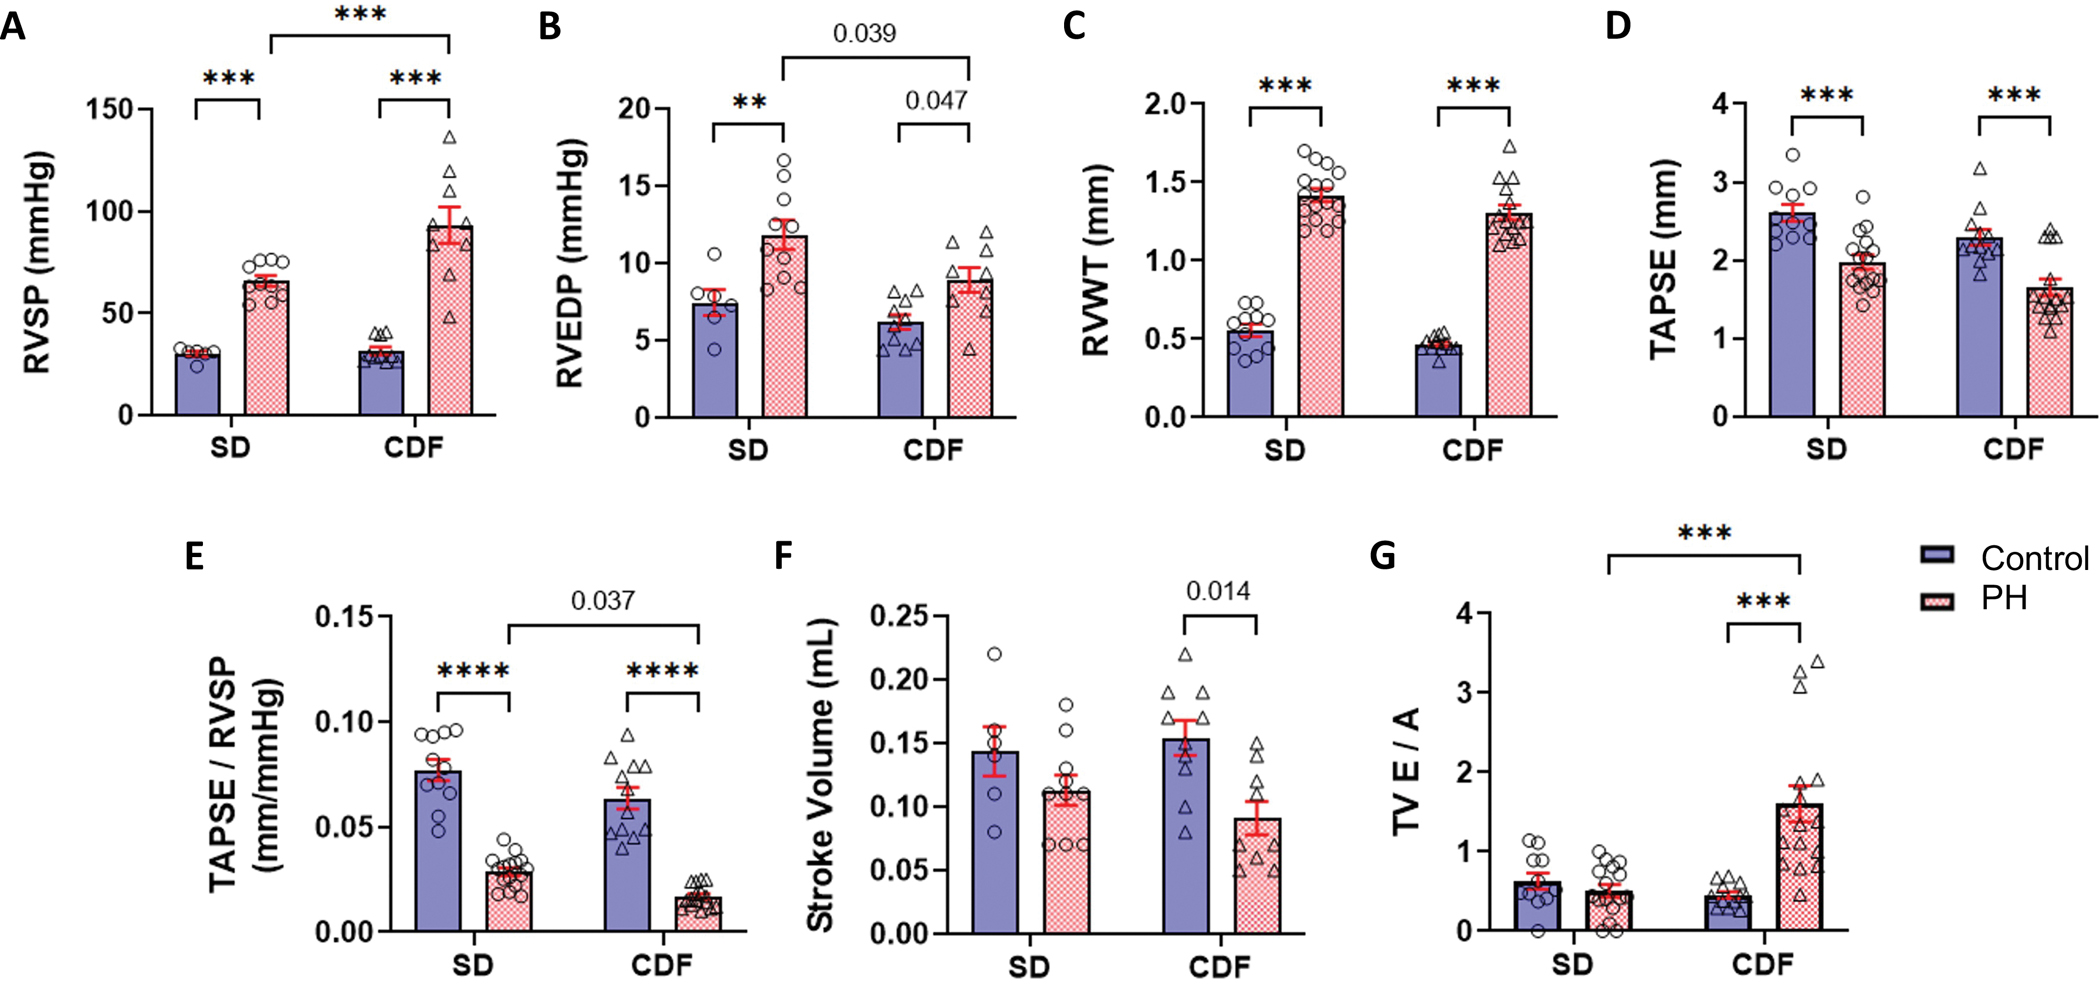
Fig. 1. Characterization of PH Models.

PH was confirmed in both models by hemodynamic (A-B) and echocardiographic measurements, as PH rats showed higher RV wall thickness (C), and RV systolic function measured by TAPSE (D) and TAPSE/RVSP (E) were significantly reduced in PH rats. Both PH models showed reductions in stroke volume (F) which were significant only for CFD-PH rats. In addition, the CDF-PH model had lower TAPSE/RVSP (E) and more severe RV dysfunction (G) in comparison to SD-PH rats. CDF: Fischer rat model; E/A: ratio of the early (E) to late (A) RV filling velocities; PH: pulmonary hypertension; RV: right ventricle; RVEDP: right ventricle end-diastolic pressure; RVSP: right ventricle systolic pressure; RVWT: right ventricle wall thickness; SD: Sprague-Dawley rat model; TAPSE: tricuspid annular plane systolic excursion; TAPSE/RVSP: measure of RV-pulmonary artery coupling; TV: tricuspid valve. **p<0.01; ***p<0.001. SD: n=6–11 Control, 10–16 PH; CDF: n=10–12 Control, 9–16 PH. Two-way ANOVA followed by Tukey post hoc test.
