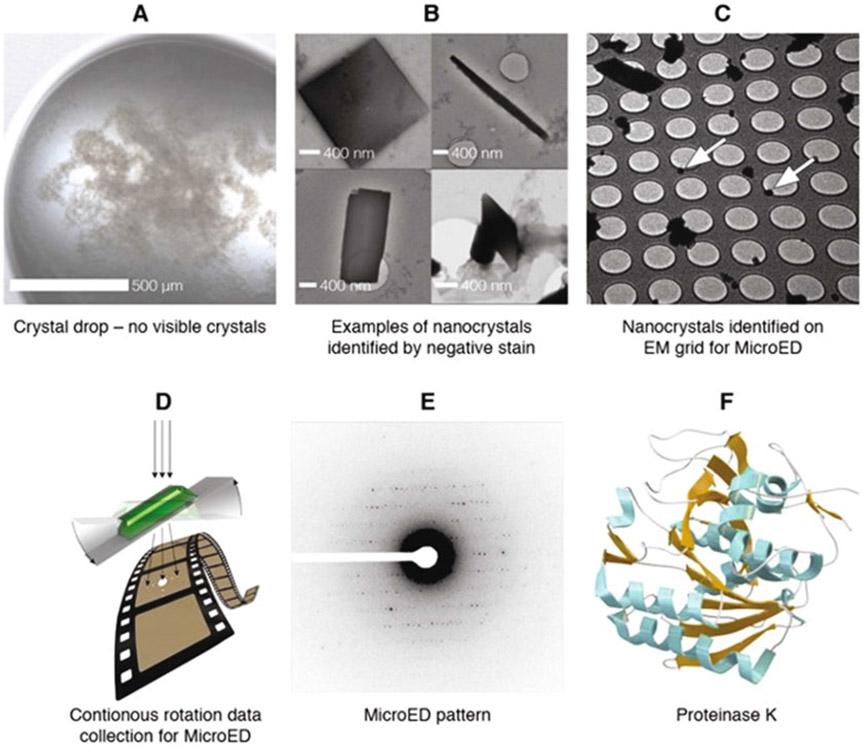
Fig. 3.
Overview of workflow. Crystal drops typically contain invisible crystals (a) that can be identified by, for example, negative stain (b). The nanocrystals are placed onto an electron microscopy grid (c, white arrows), and MicroED data are collected from a single crystal (d). The collected data (e) are processed using standard crystallographic software, yielding the structure, here exemplified by proteinase K (f) [8]

