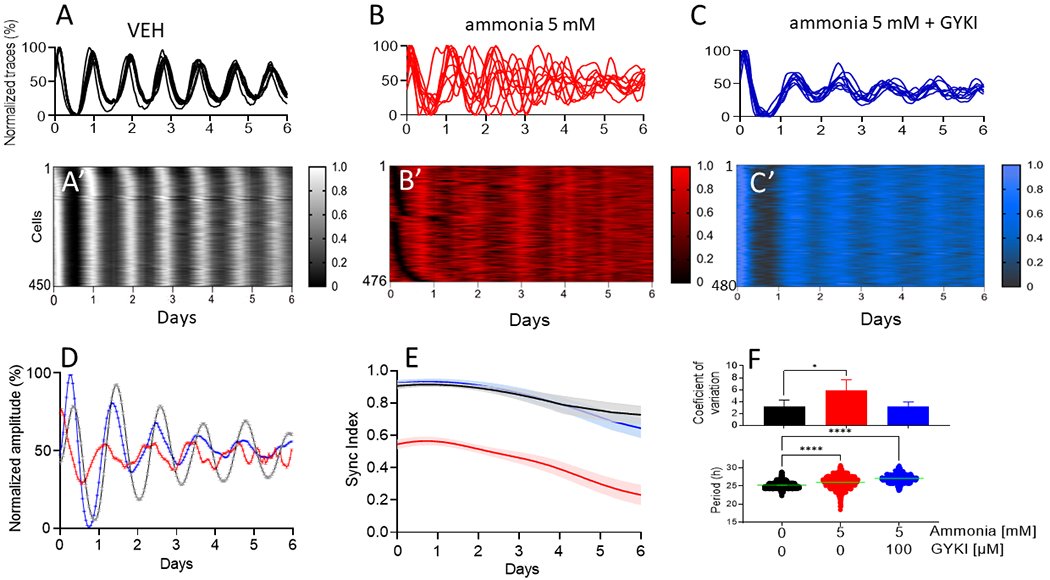
Figure 4. Ammonia induced desynchrony among single cells in adult SCN which was prevented by AMPA receptors blocking.

Representative single cell traces of PER2LUC expression in VEH (A, n=6), ammonia 5 mM (B, n=6) and ammonia 5mM + GYKI 100 μM (C, n=4) with their respective raster plots (A’, B’ and C’) depicting all cells from a representative single SCN explant showing desynchrony induced by ammonia that was prevented by GIKI application. (D) Ensemble mean±SEM PER2LUC expression traces from the same single SCN explants. (E) Group mean±SEM sync indices showing that high synchrony among SCN cells was re-stablished when AMPA receptors were blocked with GYKI. (F) Ammonia increased period (lower panel, *p>0.001) of single SCN cells which was correlated with an increase in the coefficient of variation (top panel, *p=0.03).
