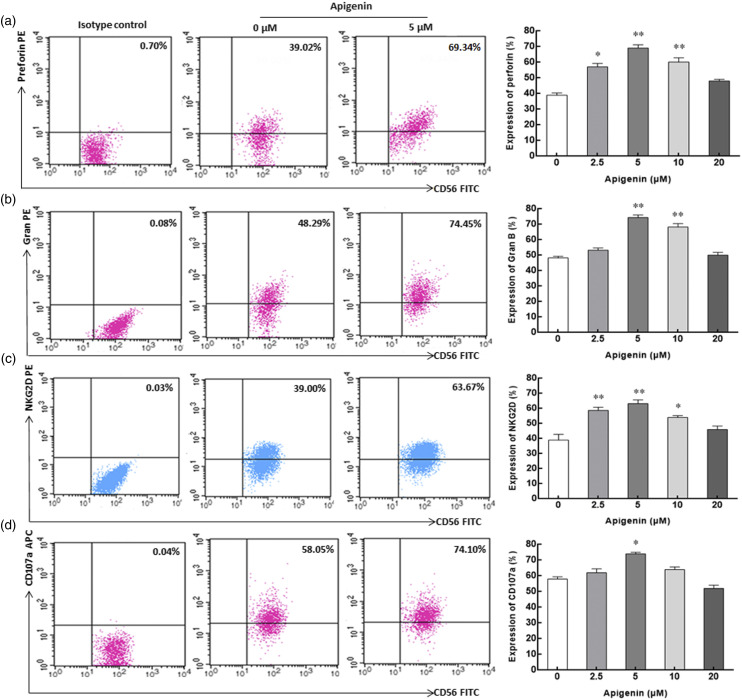
Figure 4.
The expression of surface and intracellular antigen molecules on/in NK cells incubated with apigenin for 72h. a, b, c, and d represent the expression of perforin, Gran B, NKG2D, and CD107a in/on NK cells with apigenin treatment, respectively. Representative dot plot depicting the expression percentage of surface and intracellular antigen molecules on/in NK cells in the three columns on the left (from left to right, isotype control, 0 μM control group, and 5 μM treatment group). In the rightmost column, histograms describing the expression of perforin, Gran B, NKG2D, and CD107a on/in NK cells treated with various concentrations of apigenin are shown. Data are displayed in mean ± SD. *p < 0.05, **p < 0.01 compared with the 0 μM control group.

