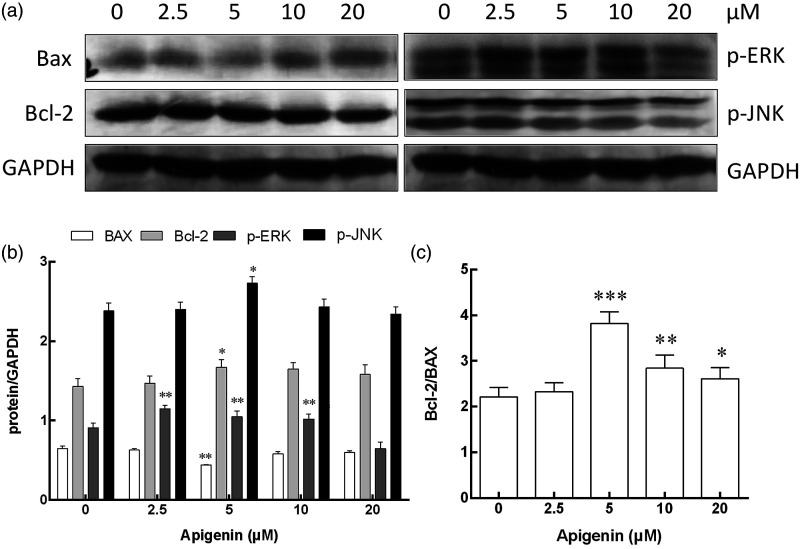
Figure 6.
The protein expression of Bax, Bcl-2, p-ERK, p-JNK, and GAPDH in NK cells after treatment with apigenin for 72 h. a: Western blot analysis for Bax, Bcl-2, p-ERK, p-JNK, and GAPDH expression in NK cells treated with apigenin at concentrations of 0, 2.5, 5, 10, and 20 μM, respectively. b: Protein activation analysis of NK cells treated with apigenin at different concentrations, the means and standard deviation are depicted as diagrams. c: The ratio of Bcl-2 and Bax in NK cells. *p < 0.05, **p < 0.01, ***p < 0.001 versus the 0 μM control group.

