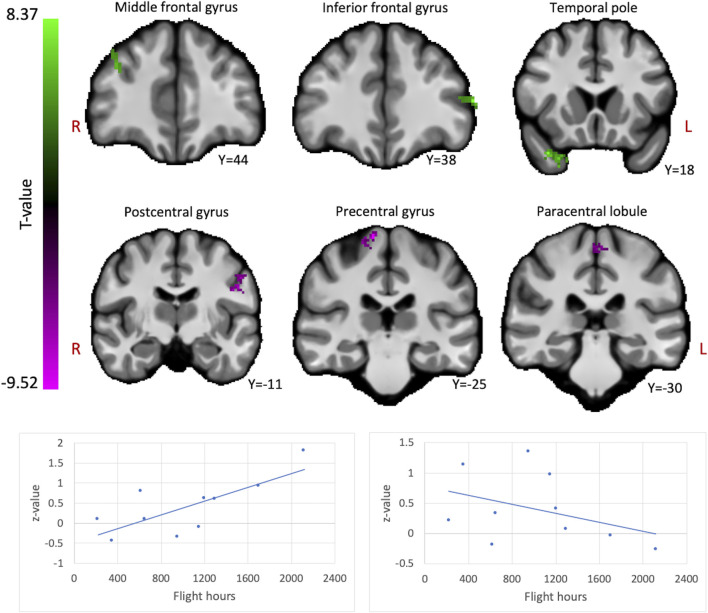
FIGURE 1.
The brain shows positive and negative correlations between global connectivity and cumulative flight hours. Positive correlations between ICC values and flight hours are illustrated in green, whereas negative correlations are illustrated in magenta. A threshold of p < 0.005 uncorrected at the voxel-level and p < 0.05 family-wise error rate at the cluster-level were applied. Age was regressed out of the analysis. Plots illustrate the average ICC values of all clusters showing positive correlations (left) and negative correlations (right) with flight hours.

