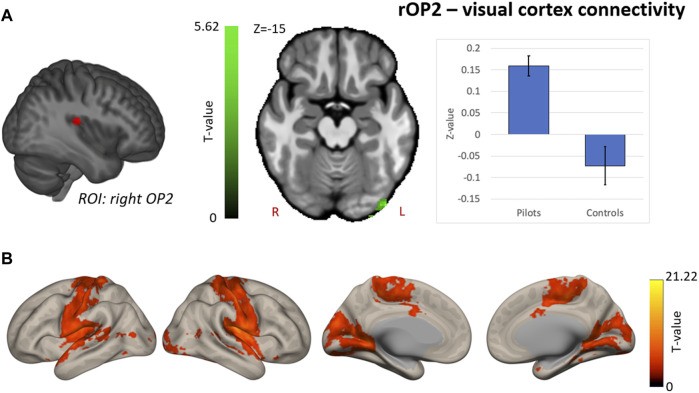
FIGURE 4.
Hypothesis-driven analysis: Comparison of functional connectivity (FC) maps of the right parietal operculum 2 (OP2) between fighter pilots and controls (A) Pilots show greater FC between the right OP2 and the visual cortex. FC increases are shown in green and are scaled by t-value (p < 0.005 uncorrected at the voxel-level, p < 0.05 family-wise error corrected at the cluster-level). The plot illustrates the average FC values between right OP2 and the visual cortex for pilots and controls (error bars indicate 95% confidence interval). (B) The associated connectivity network of the right OP2 is shown as positive correlations with the rest of the brain in red-yellow (p < 0.001 uncorrected at the voxel-level, p < 0.05 family-wise error corrected at the cluster-level). Results are scaled by t-value. R = right, L = left.

