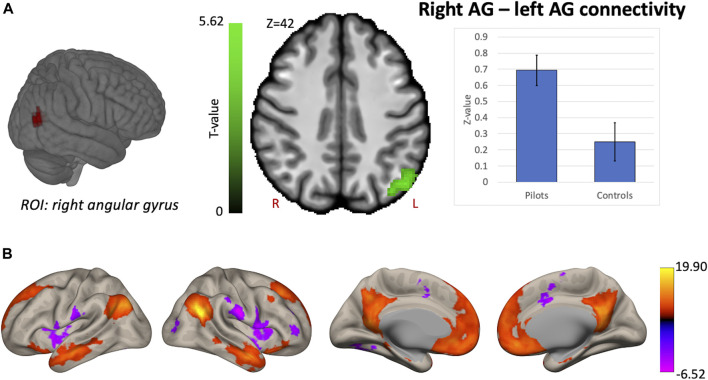
FIGURE 5.
Hypothesis-driven analysis: Comparison of functional connectivity (FC) maps of the right angular gyrus (AG) between fighter pilots and controls. (A) Pilots show greater FC between the right AG and the left AG compared to controls. FC increases are shown in green and are scaled by t-value (p < 0.005 uncorrected at the voxel-level, p < 0.05 family-wise error corrected at the cluster-level). The plot illustrates the average FC values between right AG and left AG for pilots and controls (error bars indicate 95% confidence intervals). (B) The associated connectivity network of the right AG is shown as positive and negative correlations with the rest of the brain in red-yellow and blue-purple, respectively (p < 0.001 uncorrected at the voxel-level, p < 0.05 family-wise error corrected at the cluster-level). These results are scaled by t-value. R = right, L = left.

