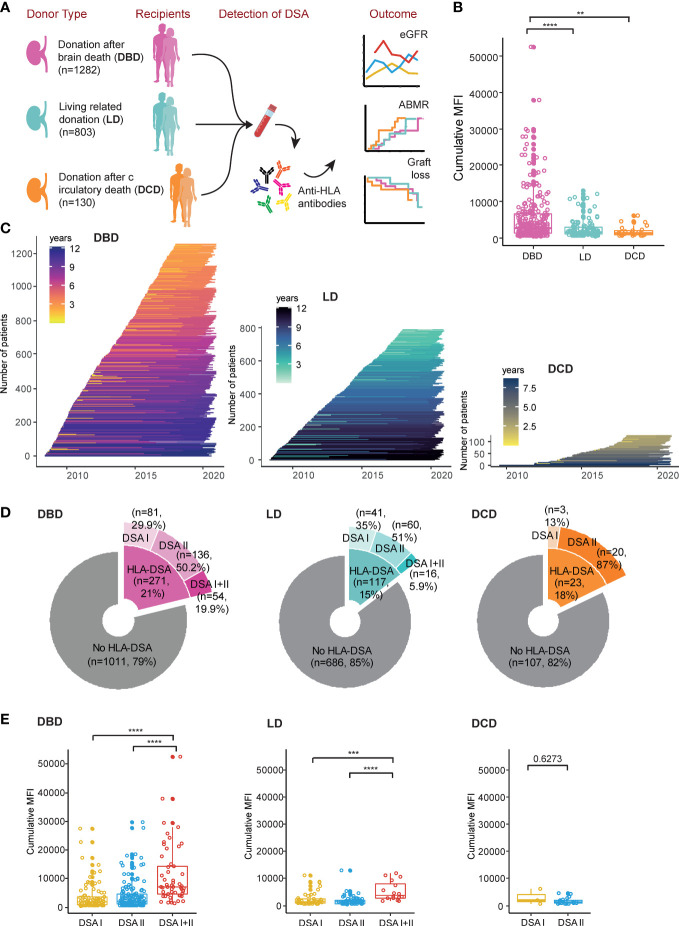
Figure 1.
Overview of the STCT cohort and the grouping of patients based on donation type. (A) Flowchart indicating the number of patients for the different donation types (DBD, LD and DCD), detection of DSA and the major analyses performed in this study. (B) The distribution of the cumulative MFI value of DSA positive patients. (C) Follow-up time in each individual patient. (D) Details of the patients in the “no HLA-DSA” group and different DSA sub-groups. (E) The summary of the cumulative MFI value of different DSA classes in the different donation types. **p<0.01, ***p<0.001, ****p<0.0001.

