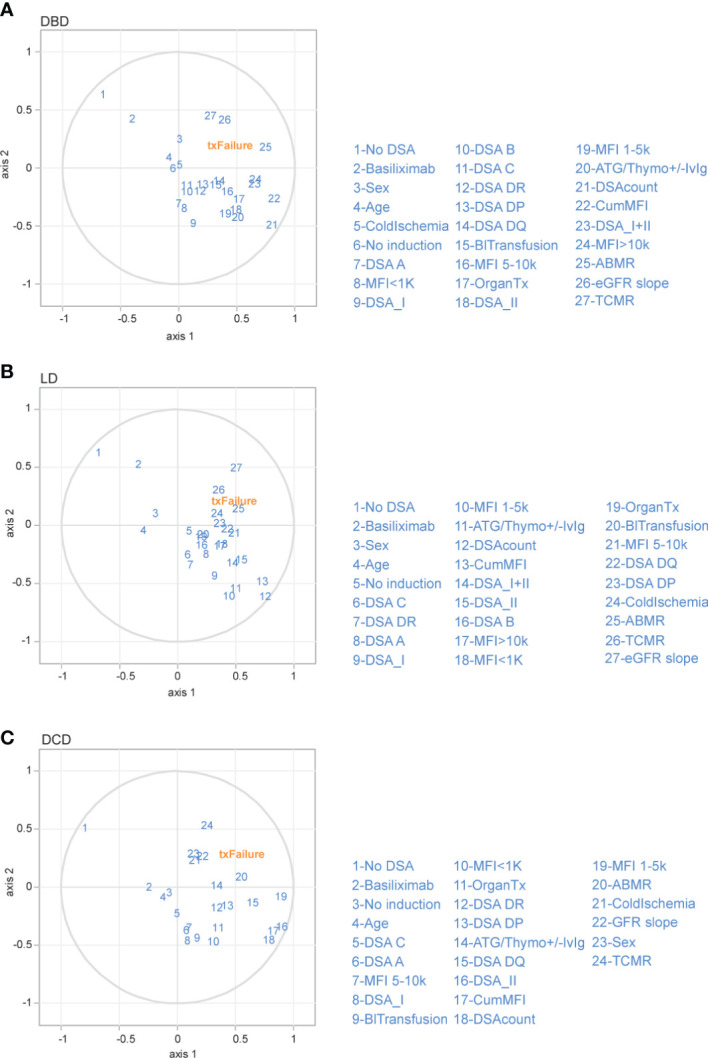
Figure 7.

Partial least squares (PLS) regression exploratory biplot for the first two components describing the correlation among different immunological risk factors to graft loss in the different donation types. Correlation shown between graft loss (txFailure) and the risk factors (in blue numbers) for DBD (A), LD (B) and DCD (C) transplants. The first two axes which correspond to PLS components 1 and 2 are shown. The distance between the individual risk factors and the center indicates the strength of the correlation with each component and their alignments represent the correlation they contribute to the variation explained by each component. (OrganTx, Organ Transplantation; BlTransfusion, Blood Transfusion; DSAcount, Number of DSA).
