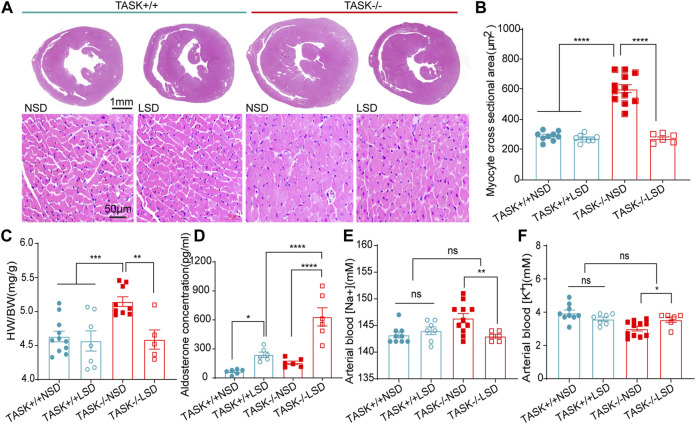
FIGURE 3.
Morphological and biochemical analysis. (A) HE staining images of transverse heart sections at the level of the papillary muscle (top images, scale bars: 1 mm) and LV myocyte cross sections (bottom images, scale bars: 50 μm). Quantification of average MCSA (>50 myocytes per heart) in the randomly selected field (B), ****p < 0.0001, one-way ANOVA with Fisher’s LSD test. The HW/BW (C), plasma aldosterone concentration (D), arterial blood Na+ (E) and arterial blood K+ (F) in TASK+/+ and TASK−/− mice with NSD or LSD (*p < 0.05, **p < 0.005, ***p < 0.0005, one-way ANOVA with Fisher’s LSD test).

