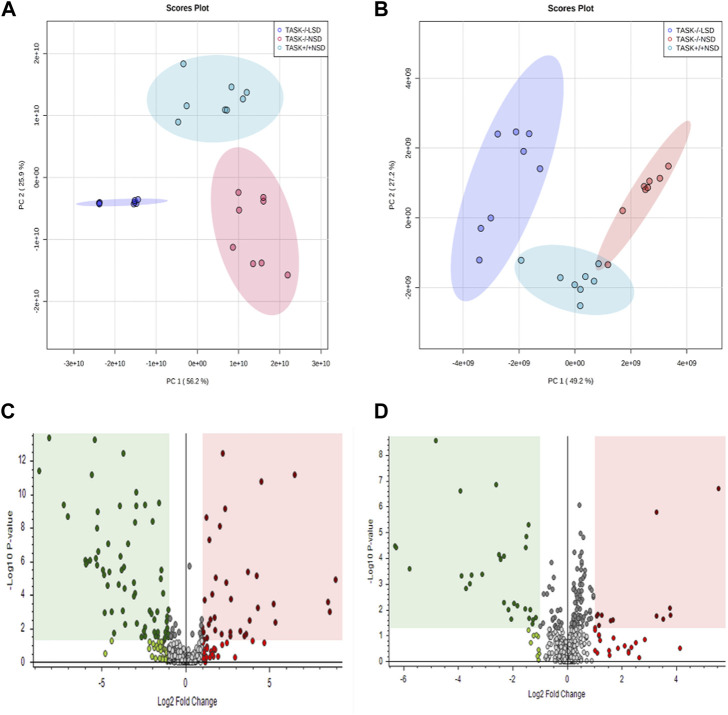
FIGURE 5.
Principal component analysis and volcano plots of detected metabolites in positive mode and negative mode. PCA scores were plotted using positive (A) and negative (B) ion mode datasets for the TASK+/+-NSD, TASK−/−-NSD, and TASK−/−-LSD groups. PC1, Principal component 1; PC2, Principal component 2. The volcano plots show the differential expression of metabolites between the TASK+/+-NSD and TASK−/−-NSD groups under positive (C) and negative (D) ion mode. Log2 Fold change is shown for TASK−/−-NSD versus TASK+/+-NSD. The pink areas represent significantly upregulated metabolites, and the green areas indicate significantly downregulated metabolites, based on Log2 Fold change and p-values <0.05.

