
Figure 3 – F4/80hi macrophages are selectively depleted from the cortex in F4/80hi macrophage knockout (F4/80 MKO) mice.
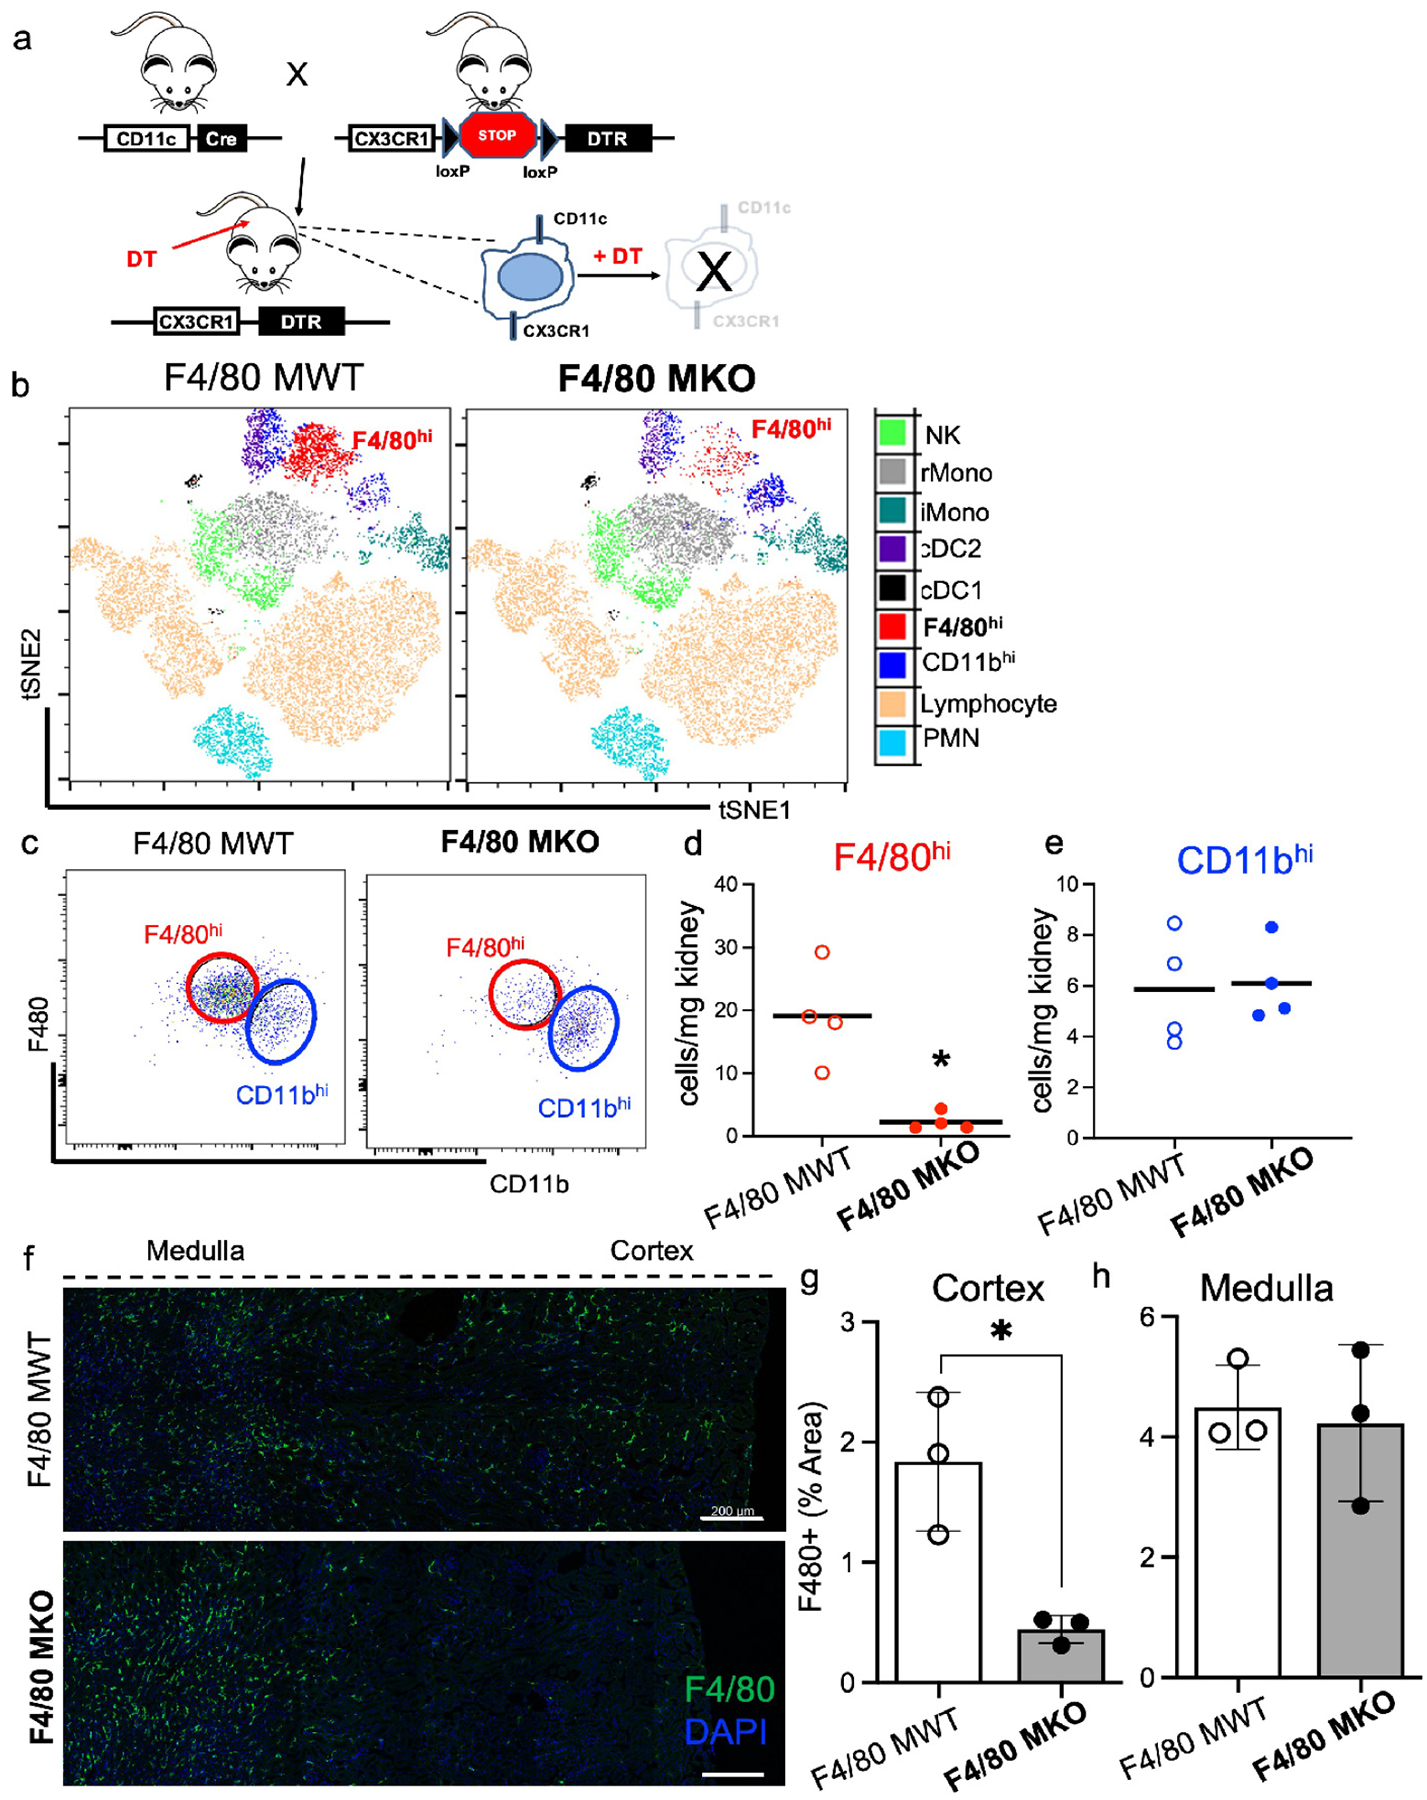
(a) Genetic strategy to deplete F4/80hi macrophages. (b-h) Mice were administered diphtheria toxin for three successive days and then flow cytometric analysis was performed one day later on kidney cell digests. (b) FACS-tSNE plot of myeloid populations within kidney demonstrating depletion of F4/80hi macrophage population in F4/80 MKO mice compared to littermate control F4/80 MWT mice. (c) Pseudocolor dot plots demonstrating gating strategy to identify F4/80hi (red) and CD11bhi (blue) macrophages in kidneys with enumeration of (d) F4/80hi and (e) CD11bhi macrophages. Graphs display line at mean, dots represent individual mice (n = 4/group) with significance determined by unpaired t test (*P<0.05). (f) Immunofluorescence staining of F4/80 (green) and DAPI (blue). Images display composite of 4 separate images taken in succession across one representative mouse kidney cross section for each genotype by confocal microscopy (scale bar – 200 μm). (g-h) Measurement of F4/80+ % area in each kidney region for (g) cortex and (h) medulla. Graph displays mean +/− SD of %F4/80+ area from 3 separate mice for each genotype (*P<0.05).