
Fig. 5.
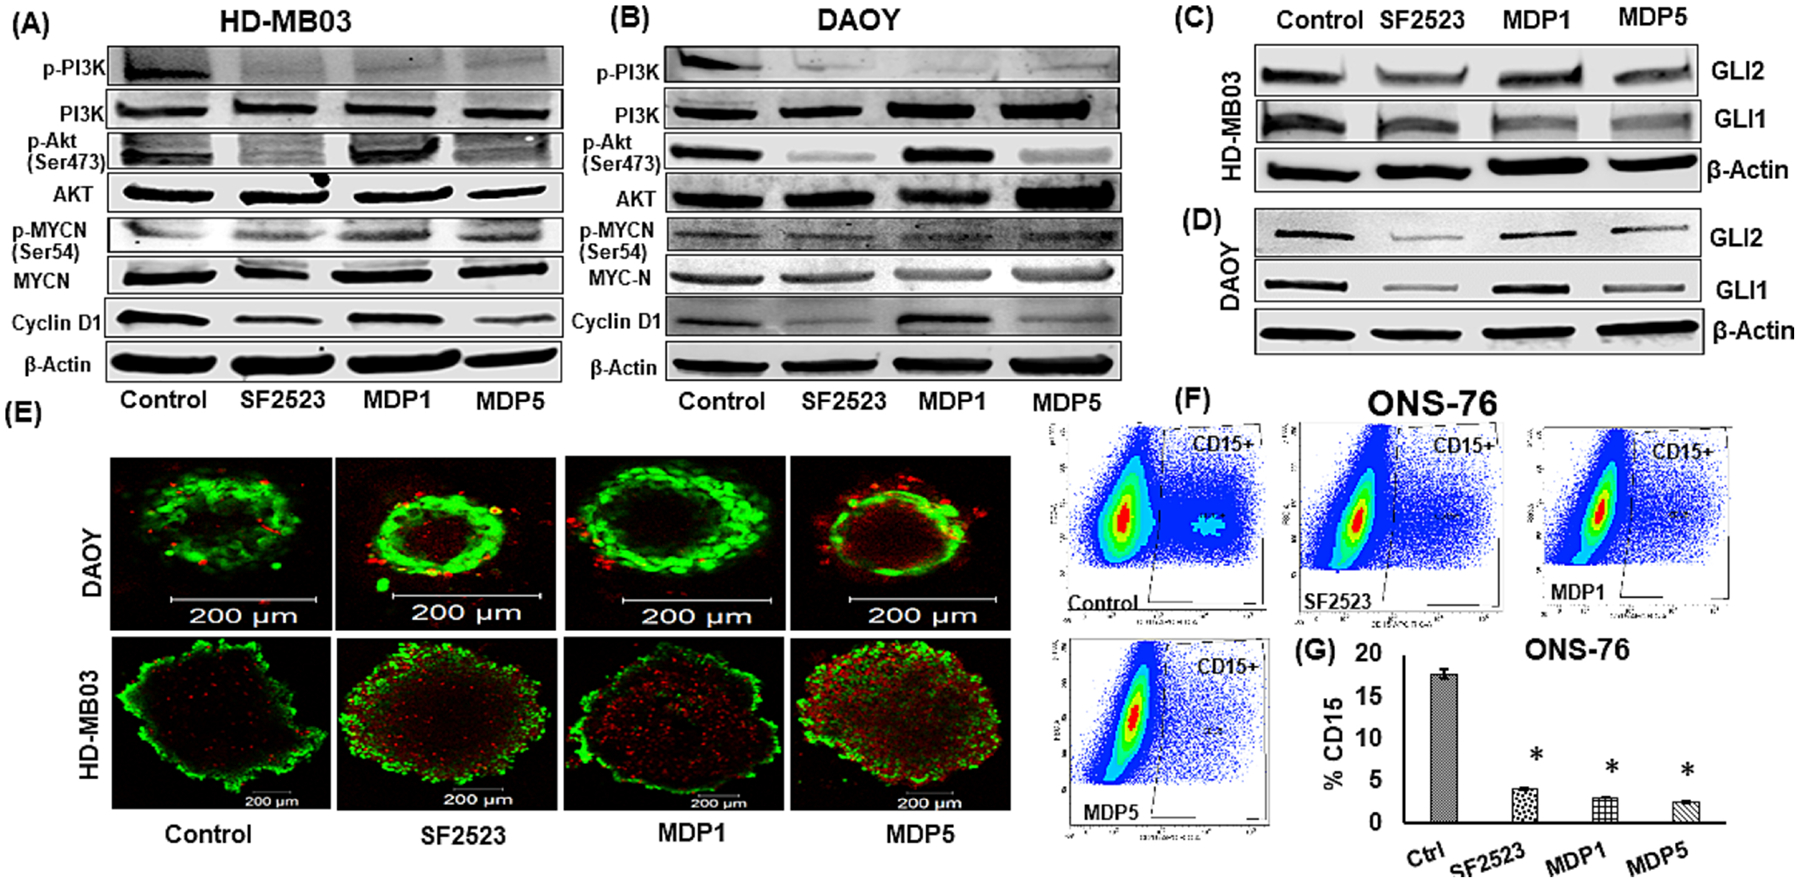
BRD4 and PI3K dual inhibitor MDP5 treatment decreases target gene expression at protein levels. A and B Western blot analysis of target proteins after HDMB03 and DAOY cells were incubated with 5.0 μM of these drugs for 48 h. C and D Effects of MDP5 treatment on target protein including GLI1 and GLI2. E Representative confocal images of DAOY and HD-MB03 spheroids after MDP5 treatment with 5.0 μM). MDP5 decreased the tumor spheroid formation in both MB cells. Spheroids were stained for live (Calcein AM; in green) and dead (ethidium homodimer-1; in red) cells after 7 days of treatment. (Scale bars = 200 μm). F Effect of MDP5 treatment on CD15+ population in MB cells ONS-76. SHH group (ONS-76 cells) were treated with SF2523, MDP1, and MDP5 for 48 h treated with 5.0 μM. Next, cells were incubated with APC-CD15 for 30 min on ice in dark. Before FACS analysis, samples were washed thrice with staining buffer. G Quantitation of CD15+ cells (n = 3. p < 0.05, control vs. treatment groups).