
Fig.2.
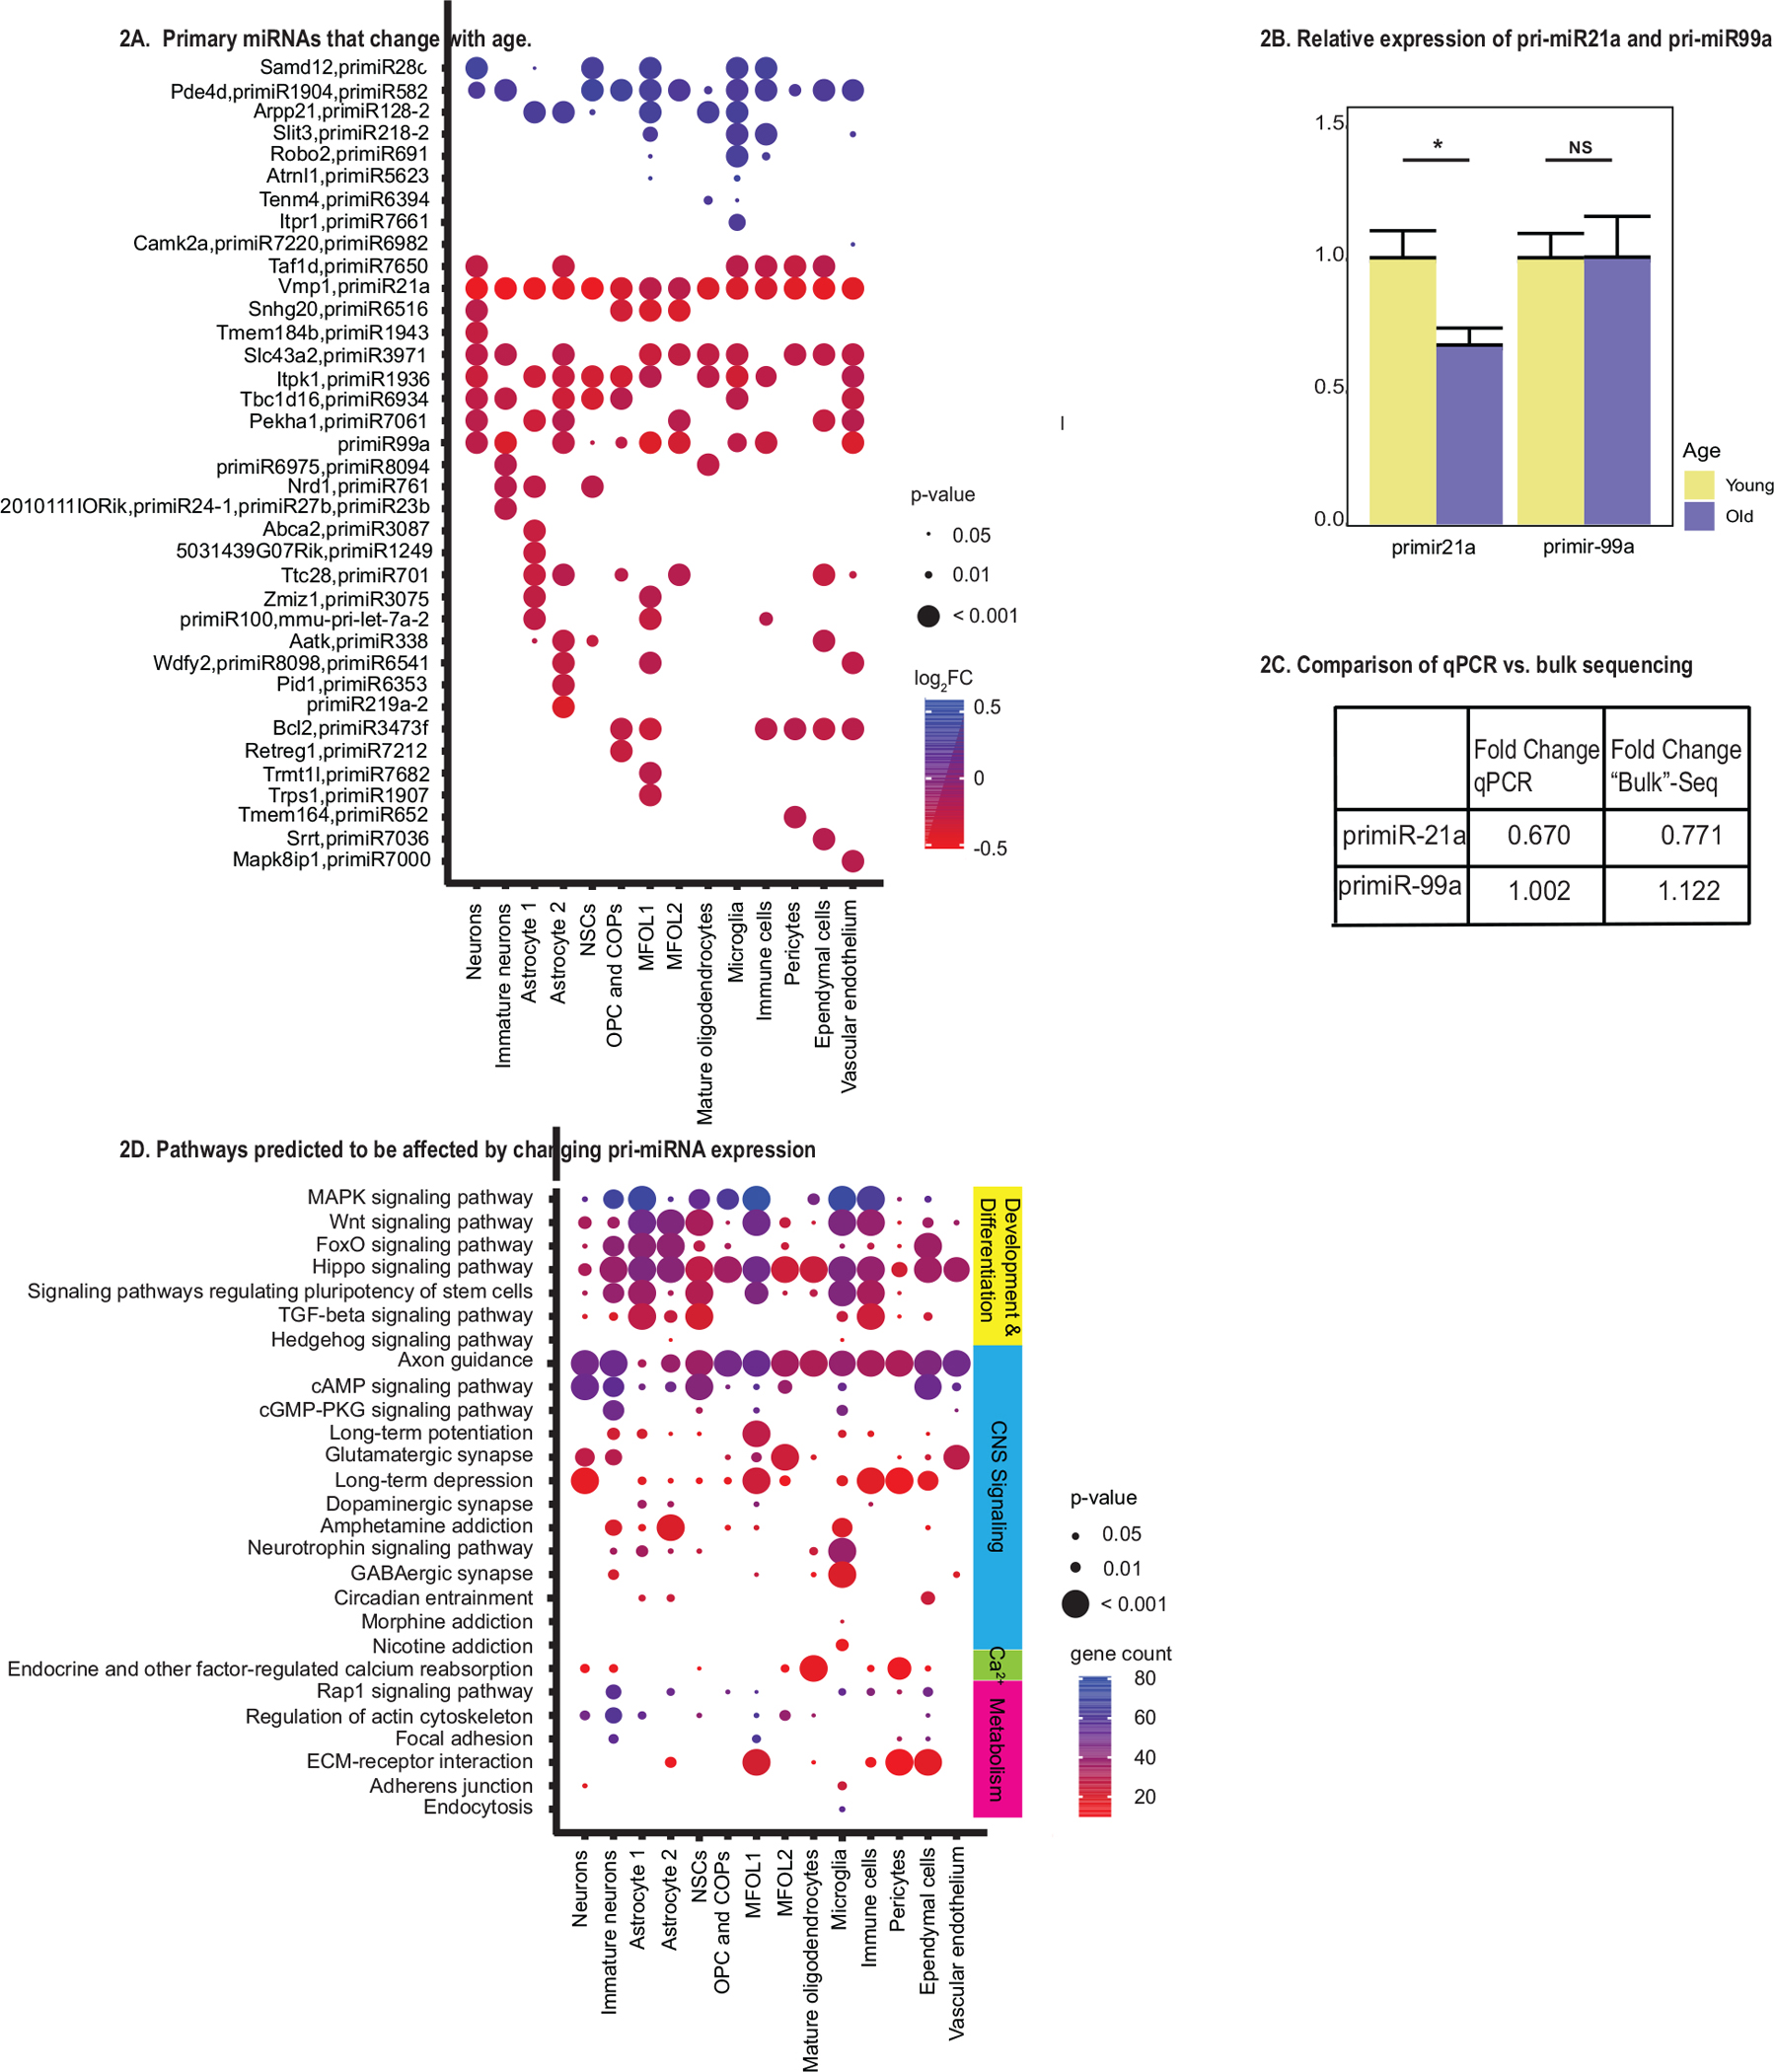
Primary miRNAs and pathways predicted to be affected in aged SVZ. A: Significantly changing primary miRNAs in the aged SVZ. Pri-miRNAs with significant differences in expression between young and old SVZ (P < 0.05). Per cell-type are shown by bubble plot. Those increasing in expression with age are shown in blue, with color intensity depicted by the log2 fold-change, while pri-miRNAs decreasing in expression with age are shown in red. B: The relative expression of primiR-21a and primiR-99a are shown from qPCR data. The yellow highlights the relative expression of whole young SVZ tissue, while the blue represents the relative expression of whole old SVZ tissue. For primiR-21a the fold change between old and young SVZ was significant (*, P < 0.05). C: Fold-change values between old and young SVZ for primiR-21a and primiR-99a in “bulk” sequencing data and qPCR. Note the change was similar using both methods. D: Bubble plot showing KEGG pathways enriched in predicted target genes of the mature miRNA sequences of pri-miRNAs that change in expression in the aged SVZ. The KEGG pathways depicted in this plot belonged to the general categories of development and differentiation, CNS signaling pathways, calcium signaling, and metabolism. All other pathways can be found in Additional File 6. Bubble color indicates the predicted number of genes affected by the changing pri-miRNAs in each pathway. Bubble size indicates the level of significance, with larger sizes indicating greater significance.