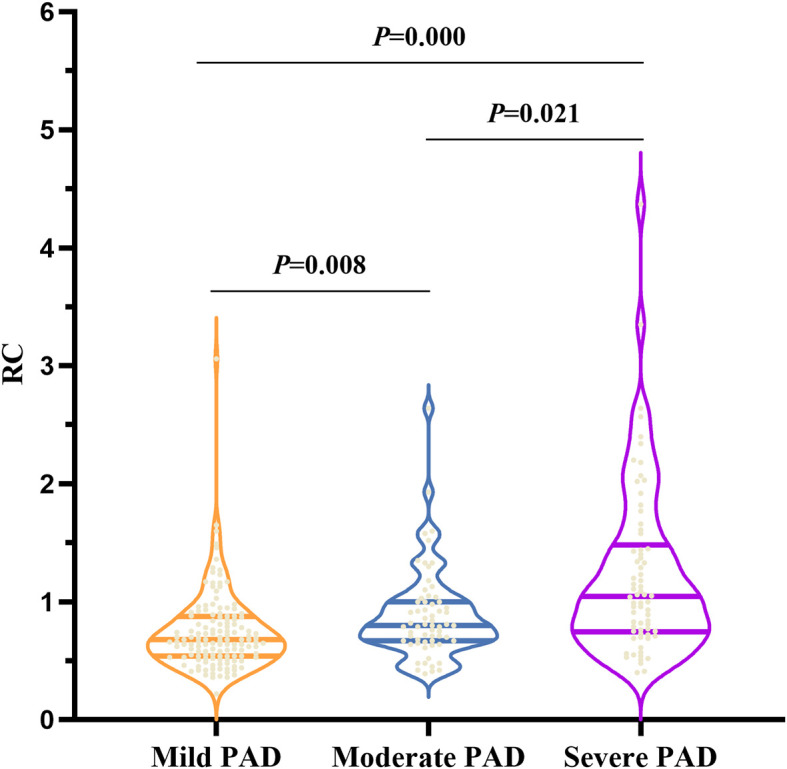
Figure 1.

The RC levels according to PAD severity based on ultrasound results. RC, remnant cholesterol. In the violin plot, the three horizontal lines from top to bottom represent the upper quartile, the median, and the lower quartile in order. P < 0.05 (two-sided) was defined as statistically significant. Bold values indicate statistically significance.
