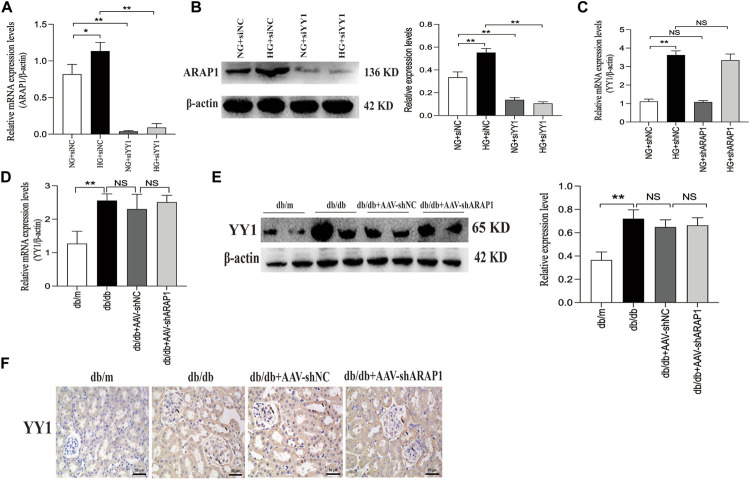
FIGURE 8.
Effect of YY1 on ARAP1 (A) Forty-eight hours after transfection of the YY1 siRNA in the NG group and HG group, the mRNA expression level of ARAP1were measured by qRT-PCR. (B) Forty-eight hours after transfection of the YY1 siRNA in the NG group and HG group, the protein expression level of ARAP1 was examined by Western blot analysis. (C) Forty-eight hours after transfection of the ARAP1 shRNA in the NG group and HG group, the mRNA expression level of YY1 were measured by qRT-PCR. (D) The mRNA expression of YY1 in the isolated glomeruli lysates of kidney tissues from the db/m, db/db, db/db + AAV-shNC and db/db + AAV-shARAP1 mice was measured by qRT-PCR. (E) The protein expression of YY1 in the isolated glomeruli lysates of kidney tissues from the db/m, db/db, db/db + AAV-shNC and db/db + AAV-shARAP1 mice was measured by Western blot analysis. (F) IHC detection of YY1 in kidney tissues from db/m, db/db, db/db + AAV-shNC and db/db + AAV-shARAP1 mice (×400). Bar = 50 μm. Arrows indicate positive staining.

