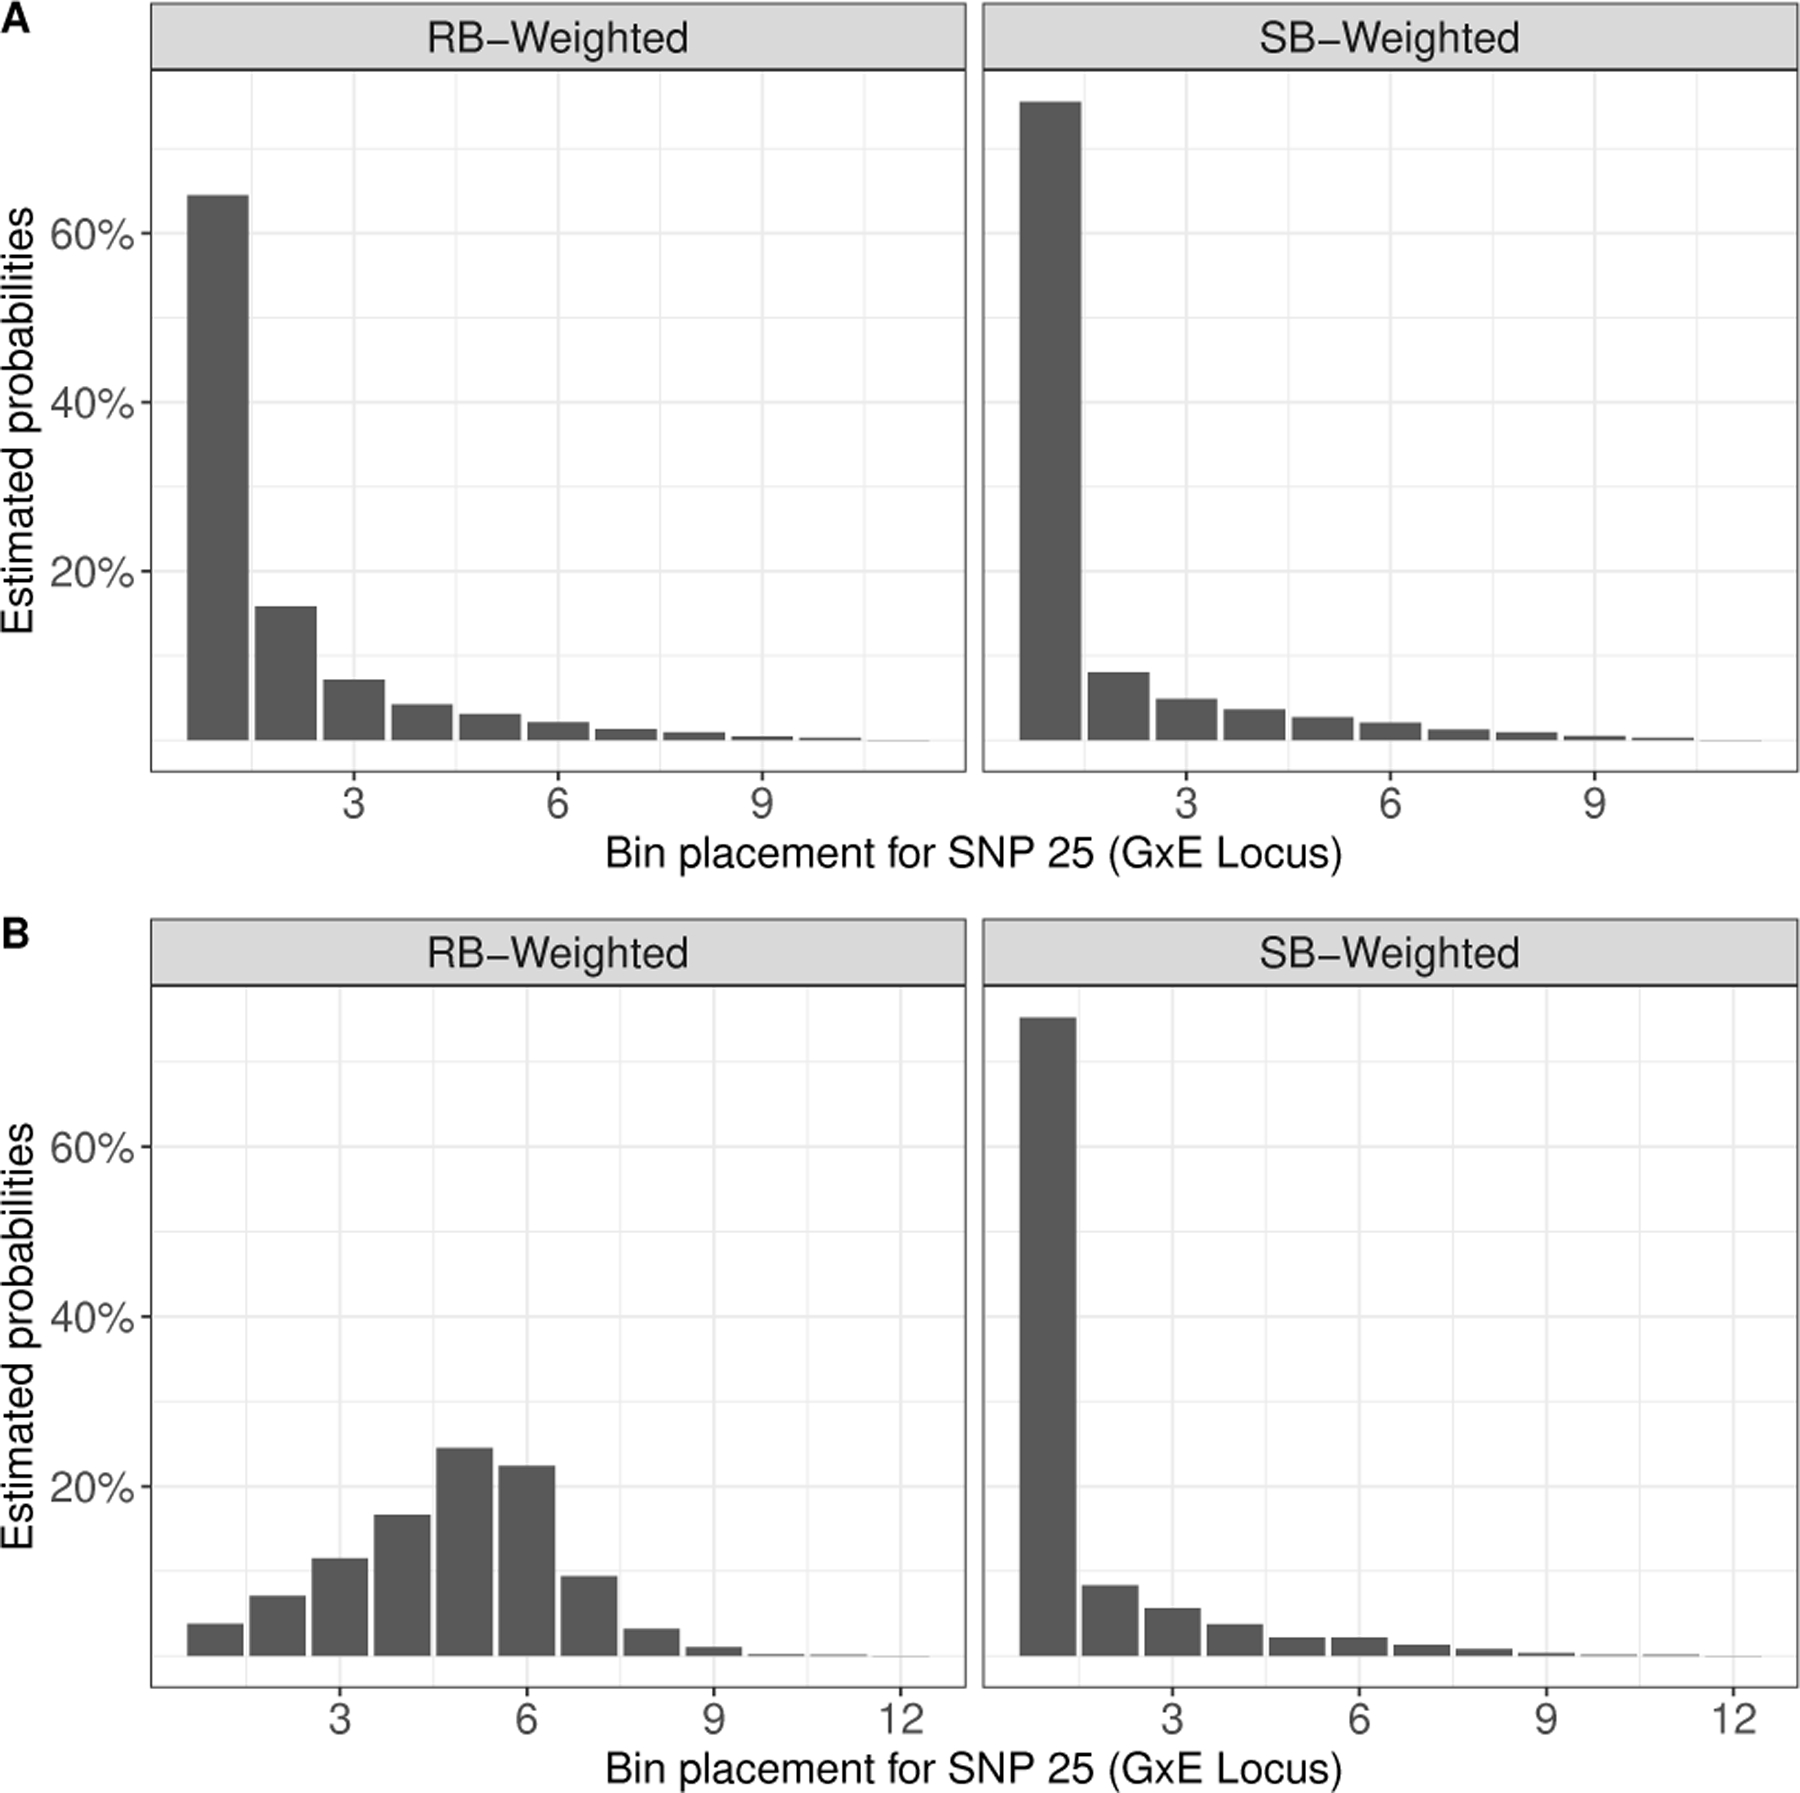
FIGURE 2.

Bar chart of bin placement for the 25th SNP (i.e. G × E locus) in Step 1 over 5,000 simulations. RB-Weighted: Rank-based weighted hypothesis testing using with initial bin size B0 in Step 1; SB-Weighted: Significance-based weighted hypothesis testing using as the p-value cutoffs in Step 1. Simulation parameters:, , N = 2, 000, M = 25, 000. Panel A) nG = 0 G-only SNPs; Panel B: nG = 80 G-only SNPs with .
