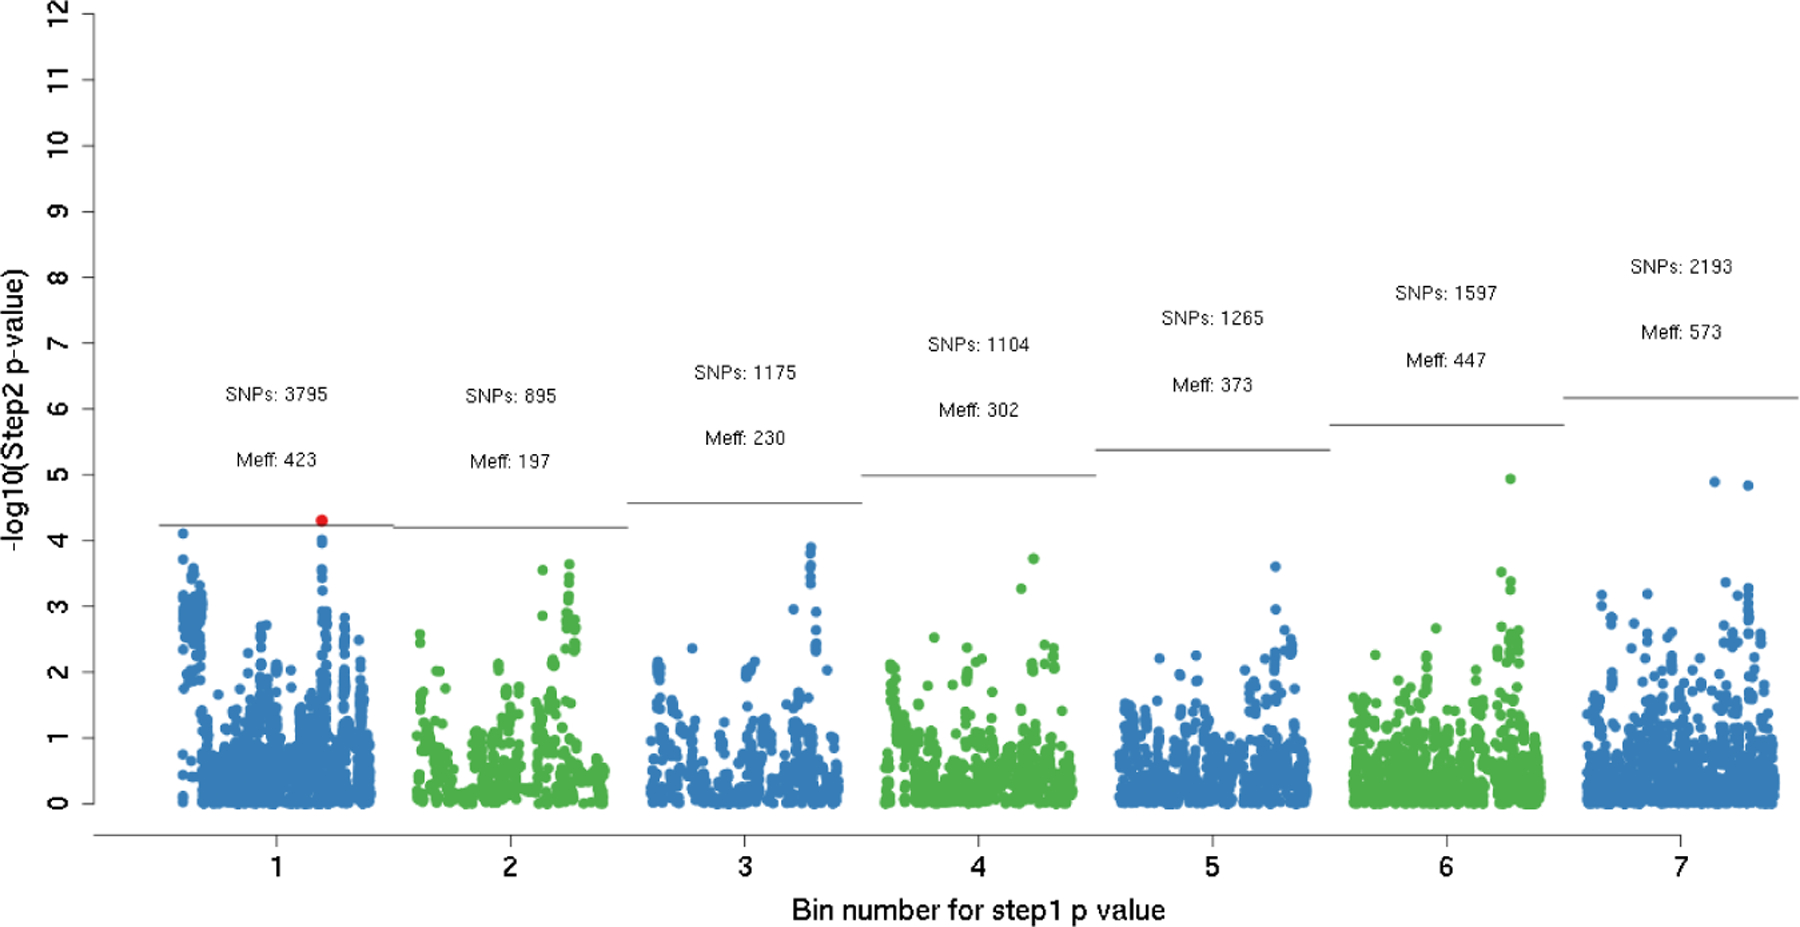
FIGURE 4.

Results from the G-by-sex interaction scan using the SB-weighted testing approach applied to the FIGI consortium data (N = 89, 304, M = 7, 809, 725). x-axis: Bins are based on the marginal outcome-gene association statistic (e.g. SNPs that have a Step 1 statistic < 5∕M are included in bin 1). y-axis: p-value of the G×E association provided by the GWIS (on the − log10 scale). Number of SNPs in each bin as well as the effective number of independent SNPs (Meff) using the simpleM approach are included. Horizontal line indicates the threshold the Step 2 p-value must cross to be statistically significant, maintaining the overall FWER=0.05. Only SNPs in the first 7 bins are shown in this figure.
