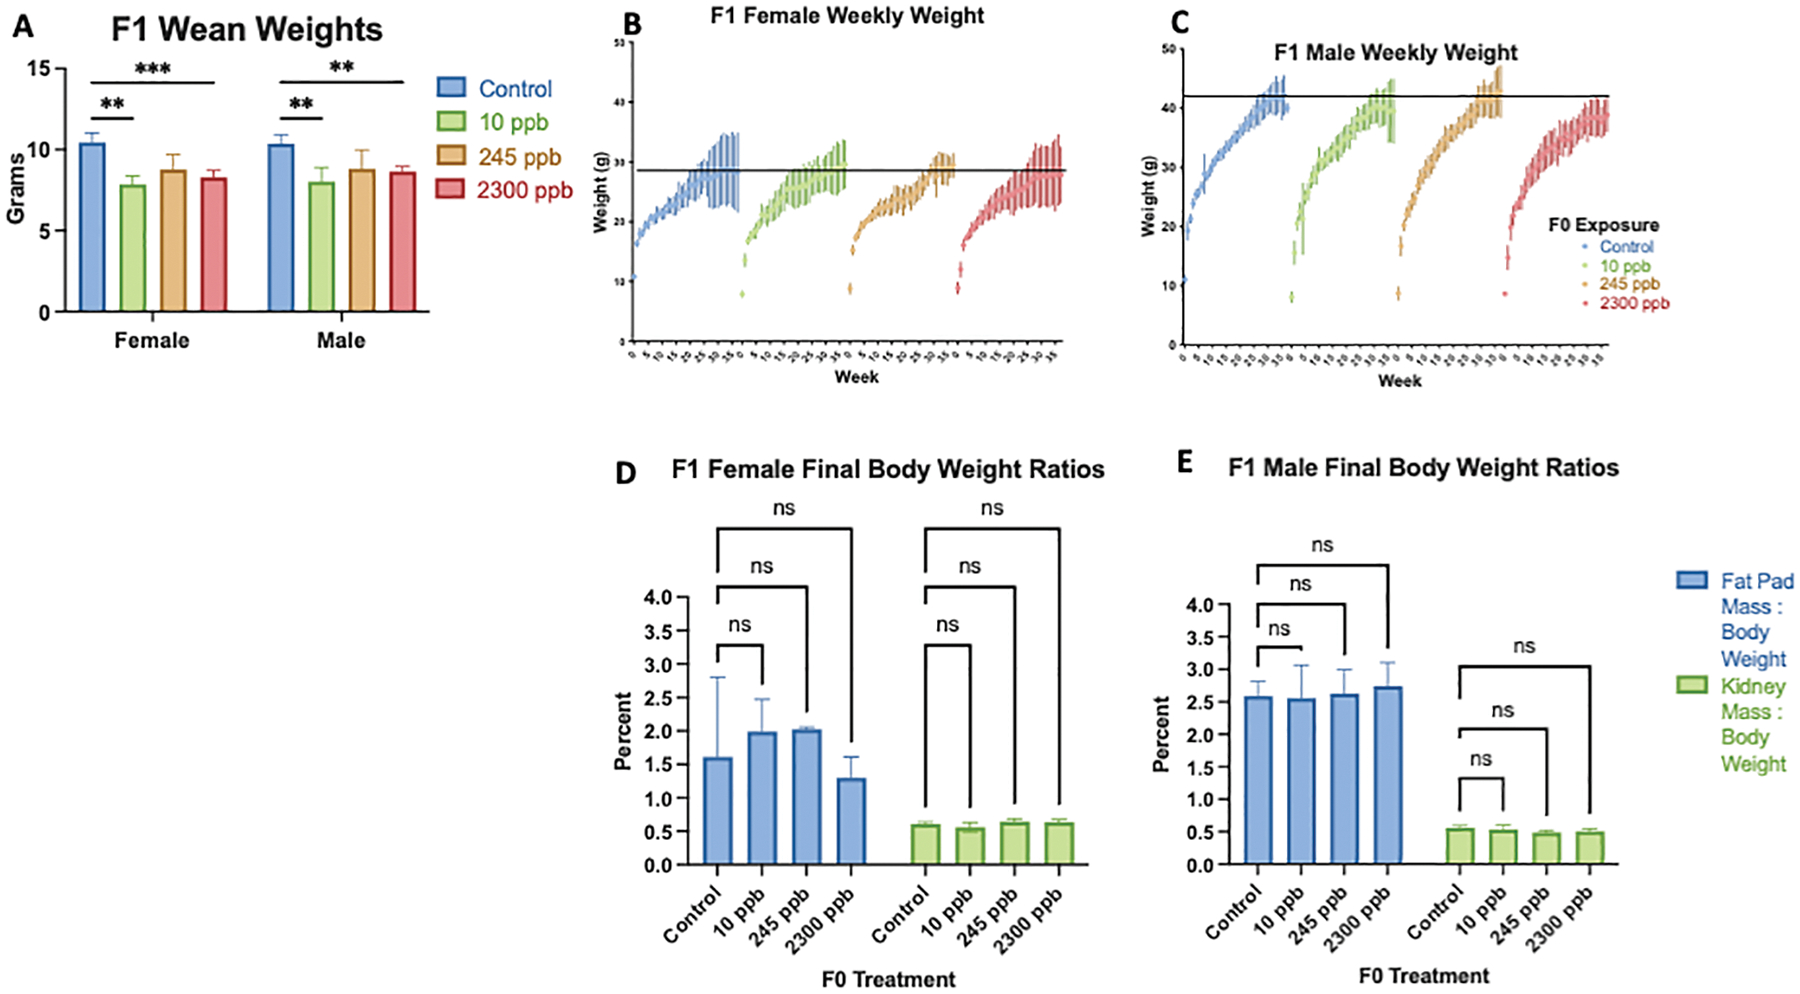
Figure 2. F1 Body weight and composition.

A) Wean weight of in utero exposed F1 mice were compared to F1 control mice. B) F1 Female weekly weight over a 40 week time period C) F1 Male weekly weight over a 40 week time period. Fat pad mass to body weight ratio and kidney mass to body weight ratio percentages at 40 weeks of age. C) Final body composition of F1 female mice. D) Final body composition of F1 male mice. All data were compared with control, presented as mean ±SEM and determined significant by a one-way ANOVA ***p<0.0001; standard error of mean. (F1 1 ppb: male n= 10, female n=7; F1 10 ppb: male n=9, female n = 4; F1 245 ppb: male n= 8, female n = 4; F1 2300 ppb: male n=7, female n=7)
