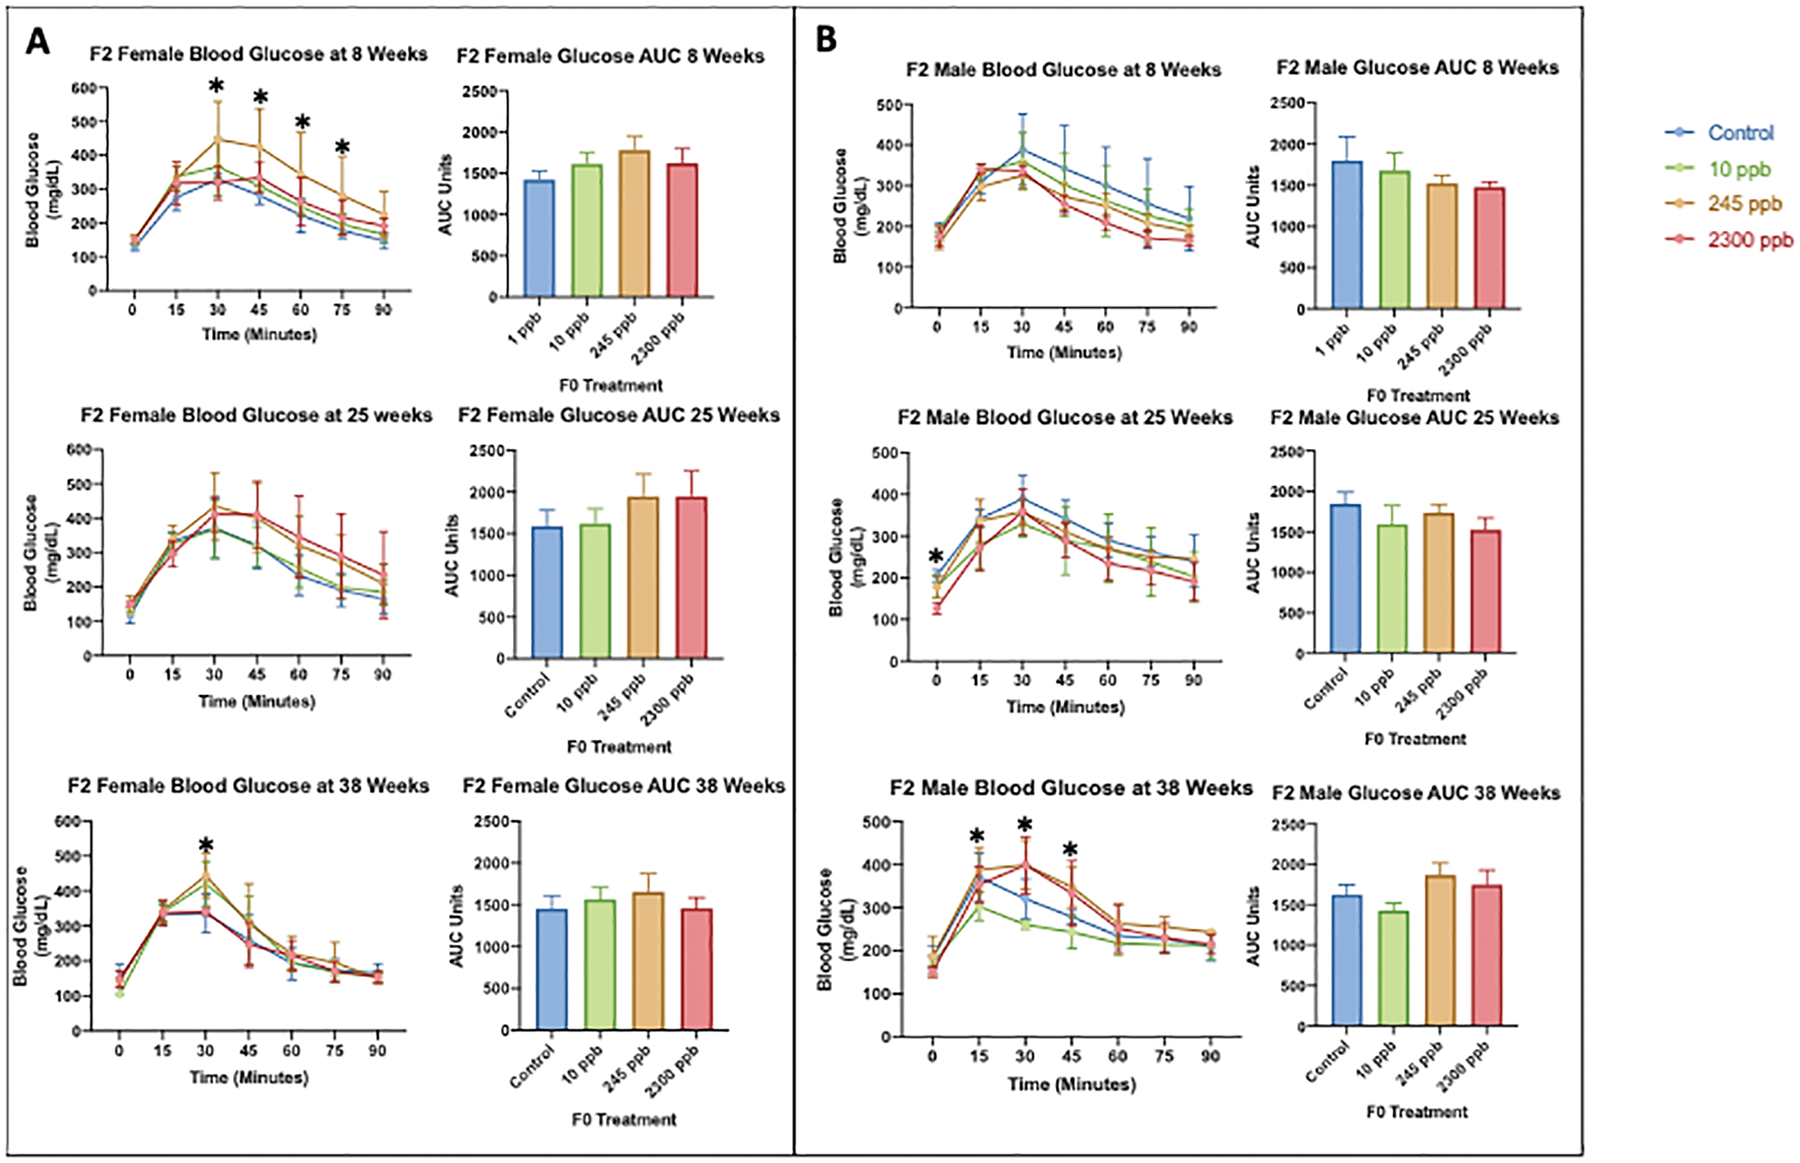
Figure 5. Blood Glucose Metabolism in F2 Female and Male Mice.

At ages 8, 25, and 38 weeks, the glucose tolerance test was preformed after a 6 hour fasting period followed by an oral administration of glucose. Tail vein blood glucose concentrations were measured at 0, 15, 30, 45, 60, 75, and 90 minutes A) F2 female mouse blood glucose data and Area Under the Curve analysis B) F2 male blood glucose data and Area Under the Curve Analysis. All exposed data were compared to the control values to determine significant differences. Statistical significance was calculated by a
