
Figure 2.
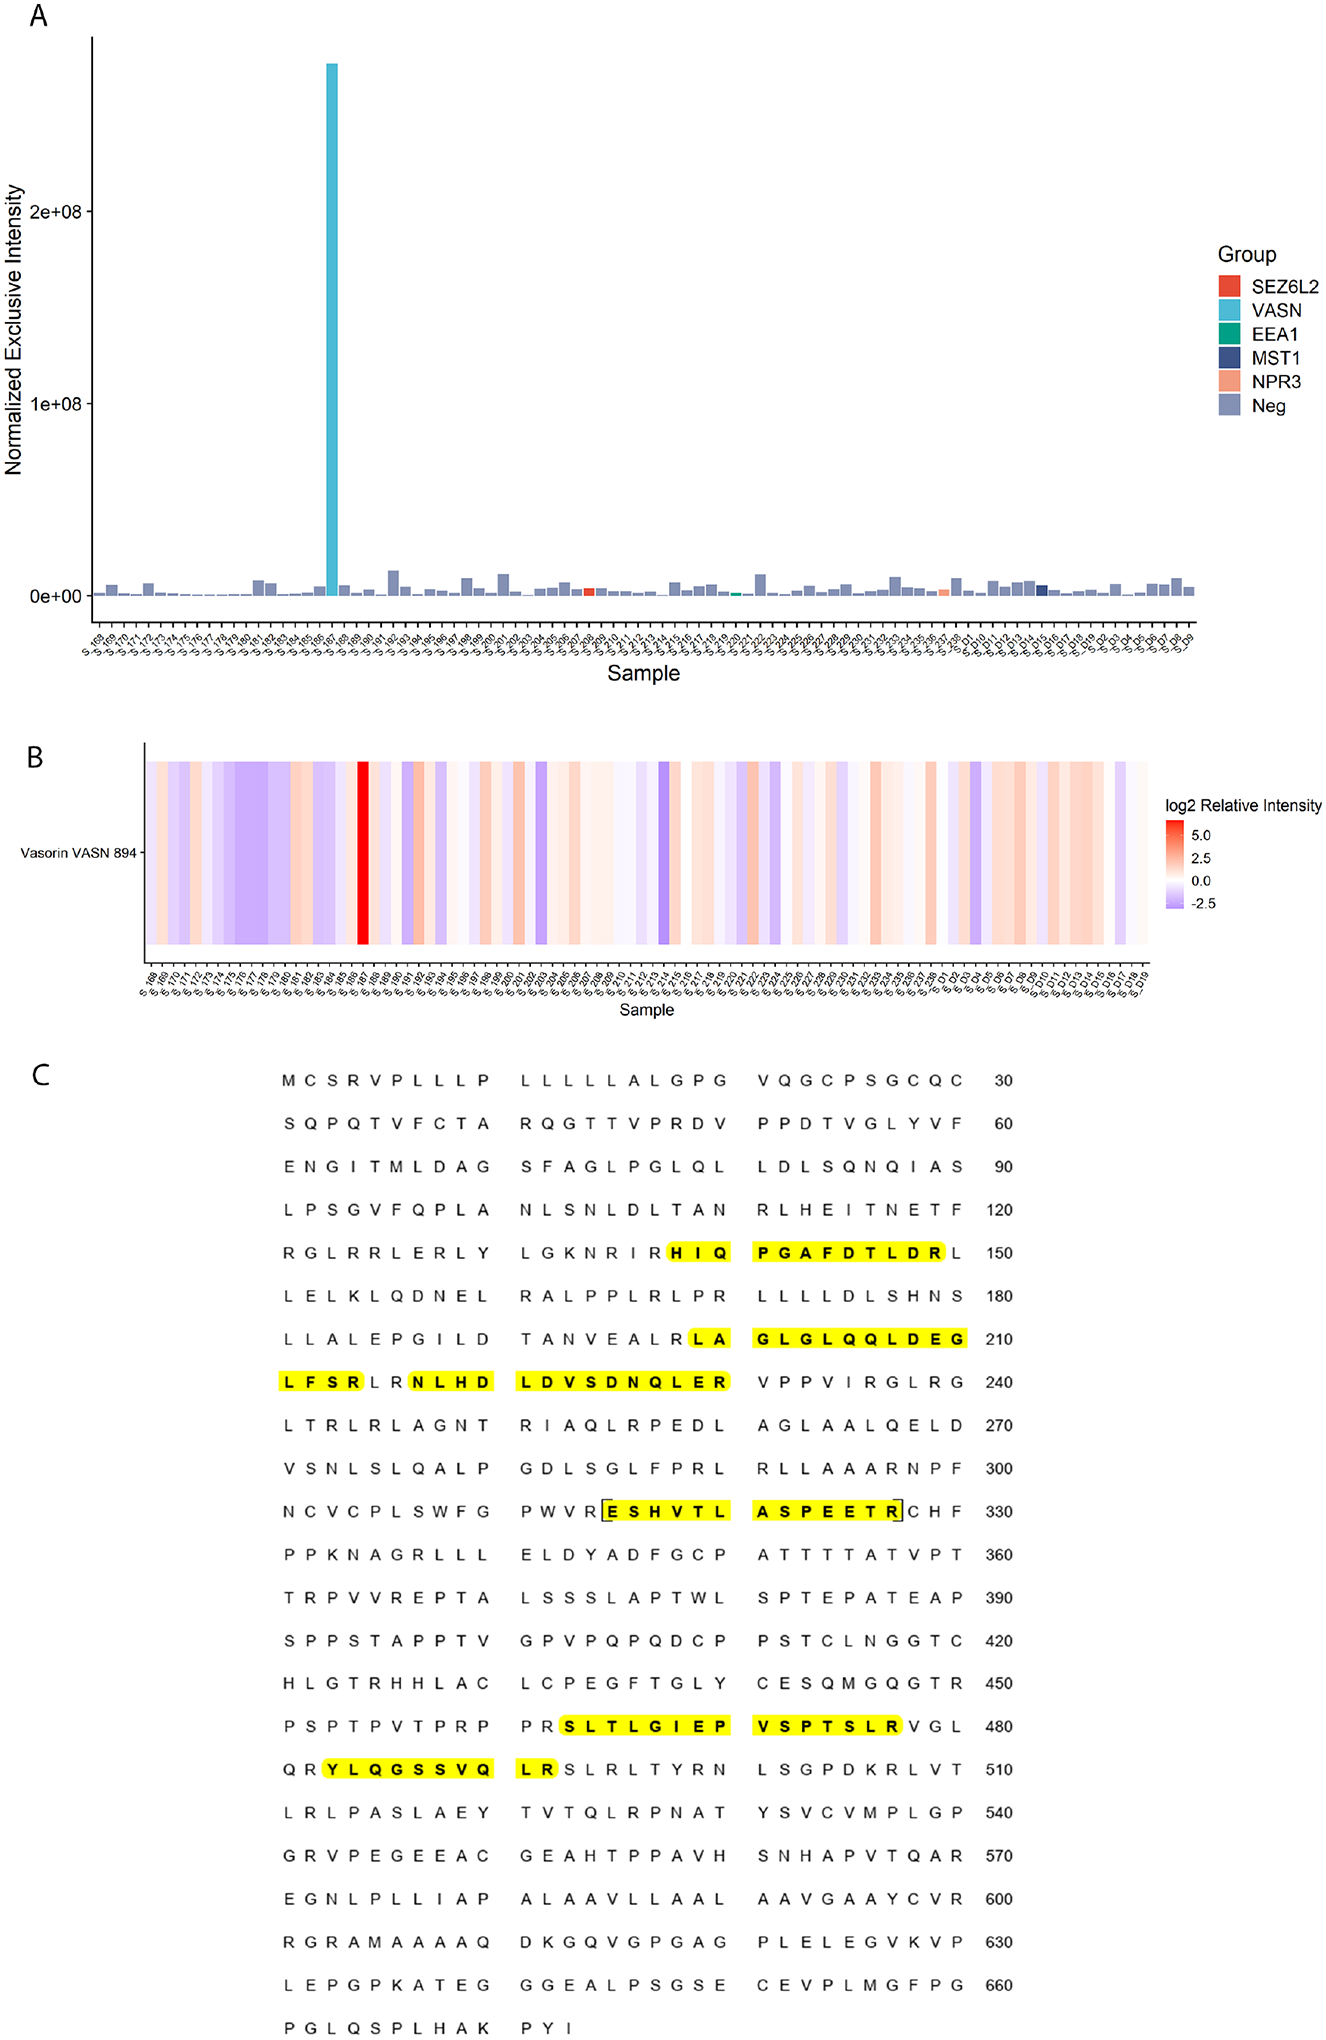
Mass spectrometry data to support identification of a putative antigen in MN, using VASN as an example. A) Scaffold exclusivity plot demonstrating VASN peptides show significantly increased normalized exclusive intensity in the VASN index case compared to other MN samples; B) Protein heat map demonstrating VASN was highly enriched in the index case compared to other MN samples; C) Sequence coverage for VASN (unique peptides highlighted in yellow).