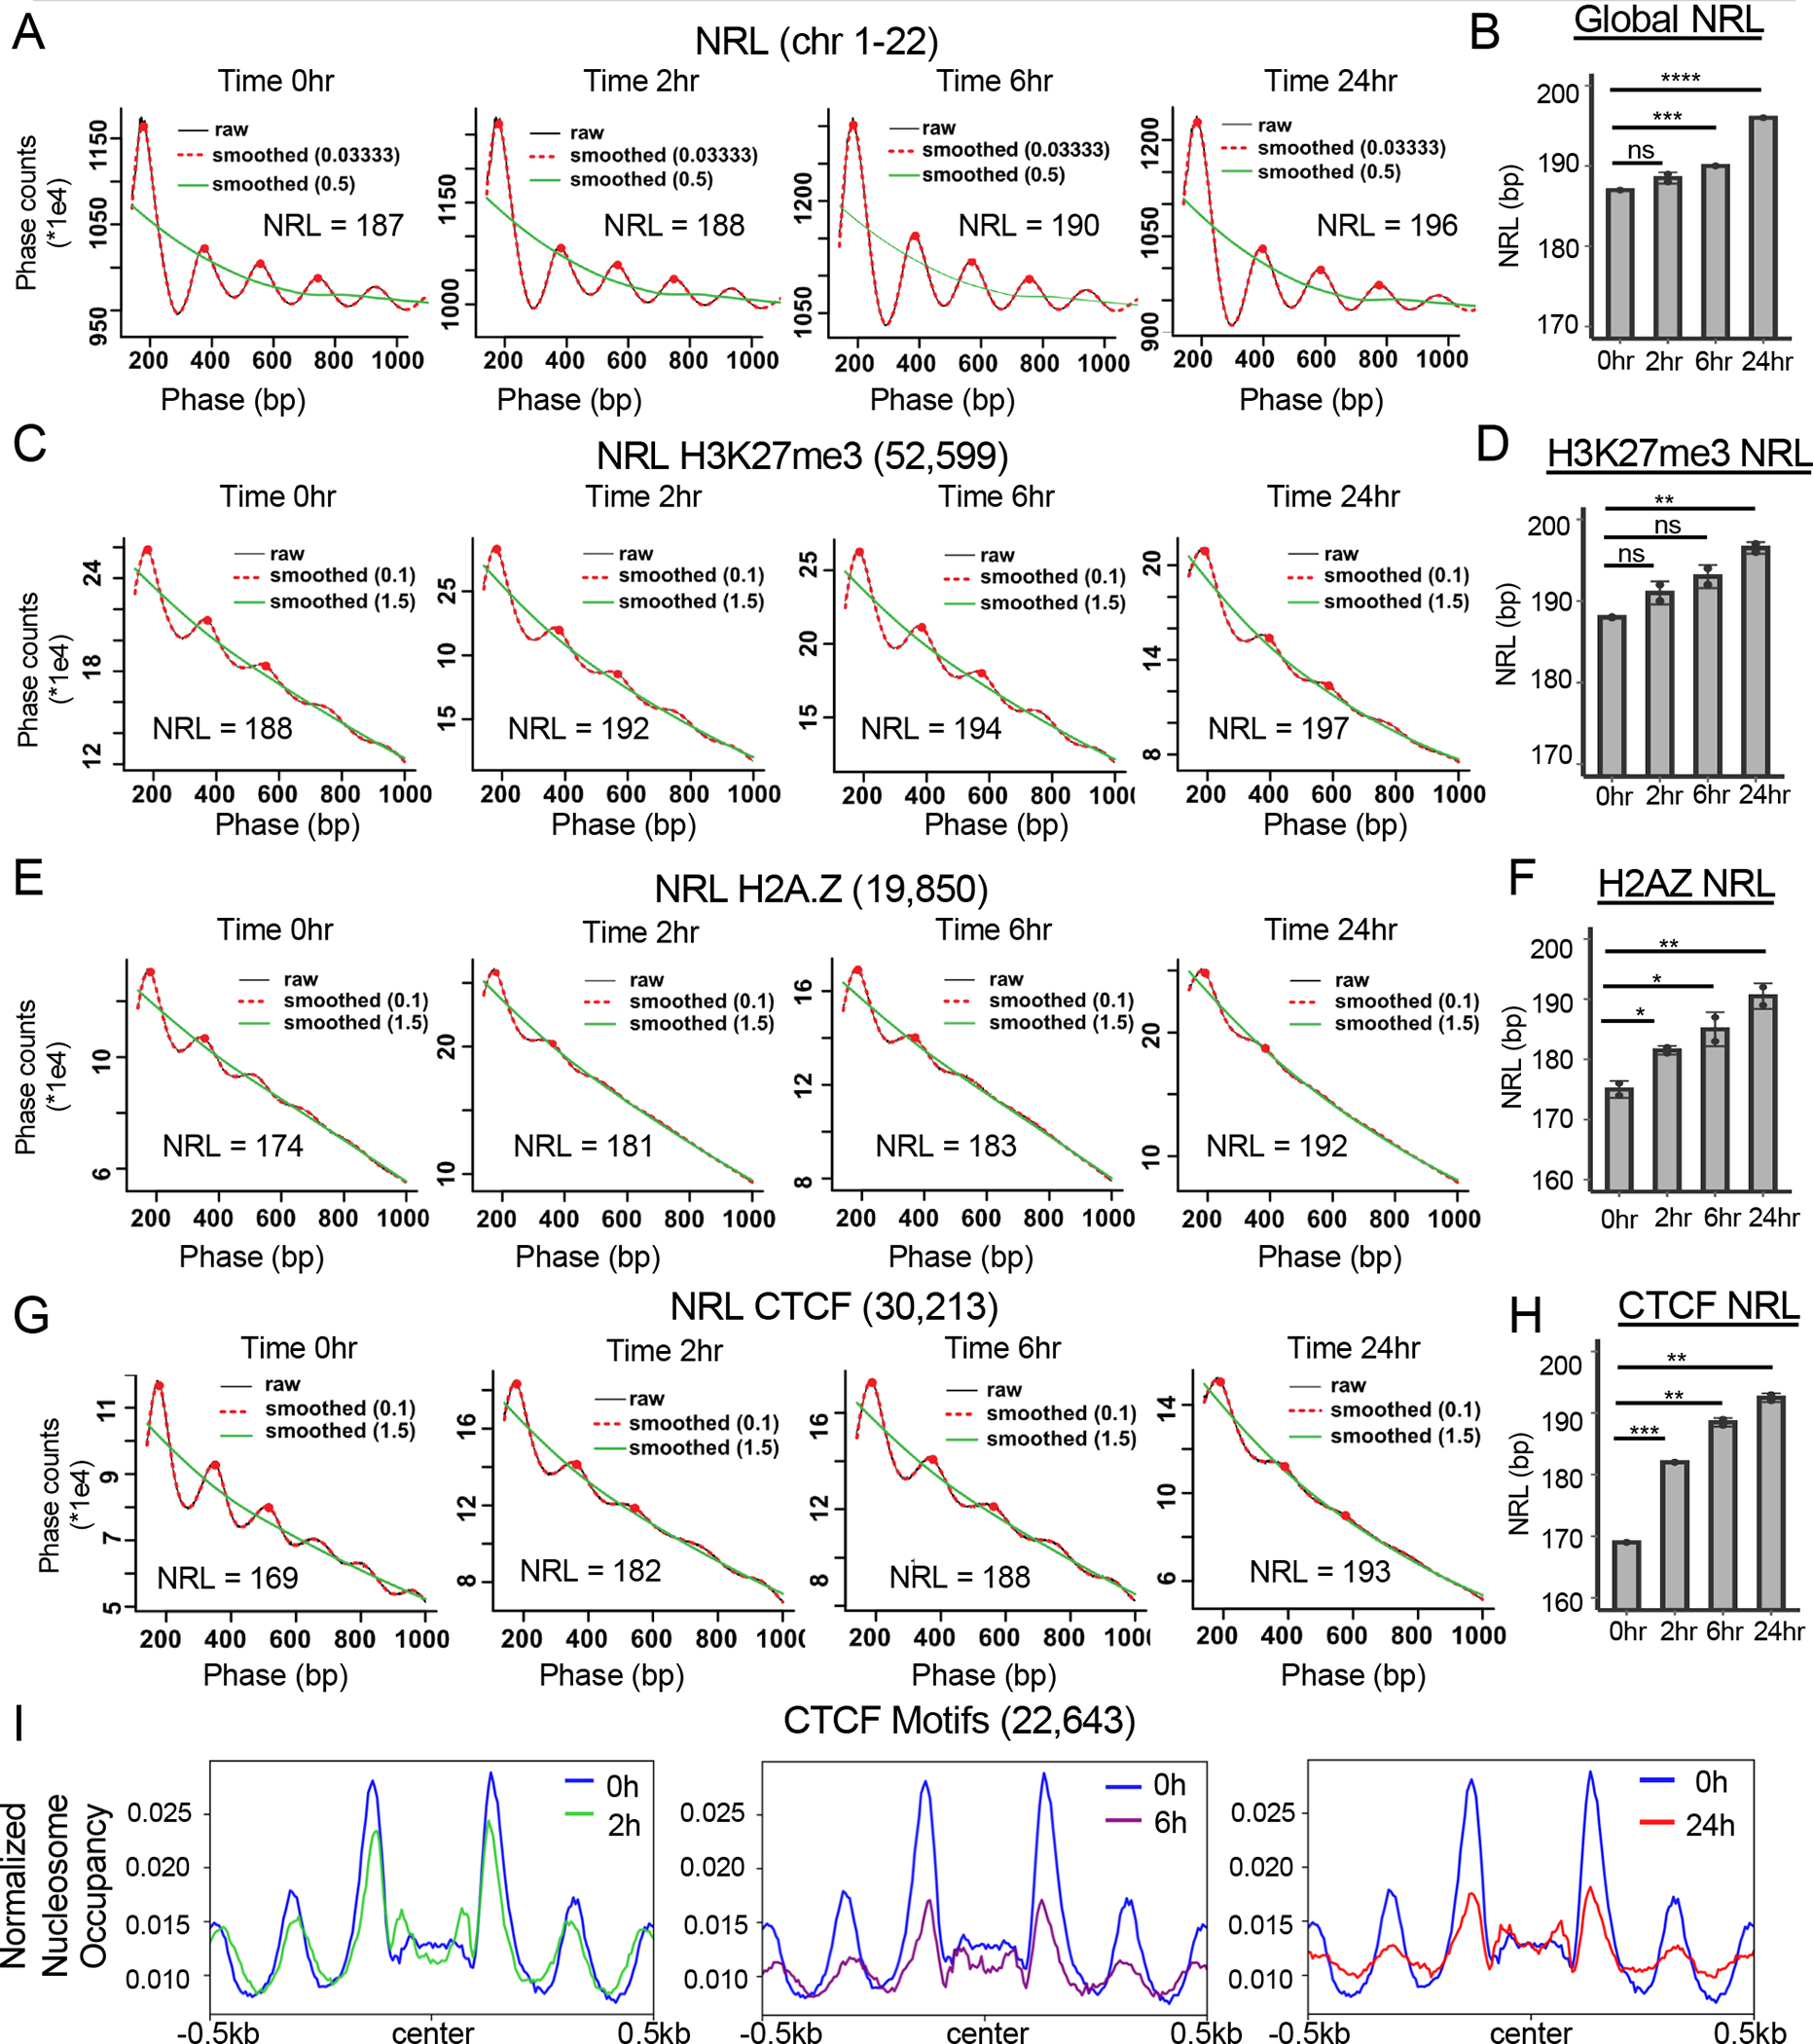
Figure 7: SMARCA5 maintains nucleosome structure around CTCF motifs in Kasumi-1 cells.

(A) “Phasogram” of the nucleosome repeat length (NRL) during the time course of SMARCA5 degradation (red line, span = 0.1, and green line, span = 1.5) derived from the MNase-seq signal of a representative replicate (grey line) using the entire genome. (B) Bar graph quantification from biological replicates of the NRL calculated from the MNase-seq signal at each of the indicated time points. (C) “Phasogram” of the NRL of SMARCA5 degradation at indicated times around H3K27me3 peaks +/−1kb. (D) Bar graph quantification of NRL at H3K27me3 peaks from biological replicates calculated using the MNase-seq signal at each of the indicated time points. (E) “Phasogram” of the NRL during the time course of SMARCA5 degradation around H2A.Z CUT&RUN peaks +/−1kb. (F) Bar graph quantification of the NRL at H2A.Z peaks of biological replicates calculated from the MNase-seq signal at each of the indicated time points. (G) “Phasogram” of the NRL at the indicated times within 1kb of the peak center of CTCF CUT&RUN peak motifs. H. Bar graph quantification of the NRL of biological replicates within 1kb of CTCF motifs at the indicated time points. I. Histograms of nucleosome occupancy using MNase-seq data plotted around all CTCF motif centers (31,015) from the CTCF CUT&RUN data. The signal was plotted +/− 500bp from the motif center and the changes after SMARCA5 degradation at the indicated time points are shown. For B, D, F, and H, the significance was calculated with Welch’s two sample t-test: ****=p<0.0001, ***=p<0.001, **=p<0.01, *=p<0.05; error bars represent standard deviation.
